OPEN-ACCESS PEER-REVIEWED
RESEARCH ARTICLE
Irene Panderi1,2,*, Kimberly Perez3, Lulu Cao1,4, Lelia Noble1, Kara Lombardo5, Thomas J. Walsh6,7, Dionysios Pantazatos6
1Brown University, Warren Alpert Medical School, COBRE Center for Cancer Research, Rhode Island Hospital, Providence, RI, USA. 2National and Kapodistrian University of Athens, Department of Pharmacy, Laboratory of Pharmaceutical Analysis, Athens, Greece. 3Brown University, Warren Alpert Medical School, Department of Hematology/Oncology, Providence, RI, USA. 4Stanford University, School of Medicine, Department of Genetics, Stanford, CA, USA. 5Brown University, Warren Alpert Medical School, Department of Pathology, Rhode Island Hospital, Providence, RI, USA. 6Weill Cornell Medicine, Cornell University, Division of Infectious Diseases, Transplantation-Oncology Infectious Disease Program, New York, NY, USA. 7Weill Cornell Medicine, Cornell University, Departments of Medicine, Pediatrics, and Microbiology & Immunology, New York, NY, USA.
Journal of Applied Bioanalysis. Vol.3. No.4. pages 81-97 (2017)
Published 15 June 2017. https://doi.org/10.17145/jab.17.012 | (ISSN 2405-710X)
*Correspondence:
Panderi I . National and Kapodistrian University of Athens, Department of Pharmacy, Laboratory of Pharmaceutical Analysis, Panepistimiopolis, Zografou 157 71, Athens- Greece. Phone:+30 2107274820.
Citation:
Panderi I, Perez K, Cao L, Noble L, Lombardo K, Walsh TJ, Pantazatos D. Assessment of molecular differentiation in FFPE colon adenocarcinoma tissues using PCA analysis of MALDI IMS spectral data. J Appl Bioanal 3(4), 81-97 (2017).
Open-access and Copyright:
©2017 Panderi I et al. This article is an open access article distributed under the terms of the Creative Commons Attribution License (CC-BY) which permits any use, distribution, and reproduction in any medium, provided the original author(s) and source are credited.
Funding/Manuscript writing assistance:
The authors have no financial support or funding to report and they also declare that no writing assistance was utilized in the production of this article.
Competing interest:
The authors have declared that no competing interest exists.
Article history:
Received: 19 August 2016, Revised 16 January 2017, Accepted 17 January 2017.
Abstract
MALDI IMS datasets comprise huge amounts of spectra and their interpretation requires the use of multivariate statistical methods. MALDI IMS spectral data have been processed using sequential principal component analysis and 2-D peak distribution tests so as to investigate the molecular differentiation of tumor regions in formalin-fixed paraffin-embedded tissue biopsies of colorectal adenocarcinoma. In some of the cases fresh frozen tissue section samples were also analyzed for comparison. Multivariate analysis of spectral data revealed a specific pattern of mass ion peaks in different tumor regions that were distinguishable from the adjacent normal regions within a given specimen. Moreover, similar mass ion peaks could be detected in both FFPE and fresh-frozen tissue section samples. These significant mass ion peaks have been used to generate ion images and visualize the difference between tumor and normal regions. These specific and statistically significant ion peaks may serve as potential biomarkers for colorectal adenocarcinoma.
Keywords
MALDI-TOF IMS, imaging mass spectrometry, colorectal adenocarcinoma, formalin-fixed paraffin-embedded tissues, principal component analysis.
Introduction
Matrix-assisted laser desorption/ionization imaging mass spectrometry (MALDI IMS) for direct tissue analysis is a very active field of research, and has seen impressive progress in recent years [1-7]. This technology allows for the visualization of the distribution of biomolecules (peptides, proteins and lipids) across a tissue section where the relative abundance of hundreds of biomolecules can be mapped across the entire tissue section [8-13]. It is thus possible to use MALDI-IMS spectral data of tissue biopsies to detect numerous cancer-associated biochemical changes [14]. This technology has opened new perspectives in the discovery of biomarkers for the diagnosis of cancer and classification of the disease pathology [15].
In this paper, MALDI IMS has been used and combined with sequential principal component analysis (PCA) and 2-D distribution tests to unveil the molecular profile in formalin-fixed paraffin-embedded (FFPE) tissue biopsies of colorectal adenocarcinoma. In some of the cases fresh frozen tissue section samples have also been analyzed for comparison. Adenocarcinoma is the most common histologic type of colorectal cancer, with etiologies which include genetic factors, environmental exposures as well as inflammatory conditions of the digestive tract [16-18]. Despite advances in colorectal treatment, the overall 5-year survival rates for patients with advanced disease is 5 to 10%, therefore, defining molecular patterns specific for various tumor regions may provide further insight regarding tumor behavior, diagnosis and prognosis. A number of studies have been carried out to search for biomarkers for colorectal cancer in various biomaterials [19]. Characterization of the molecular landscape of colorectal cancer has revealed that specific genomic and proteomic signature profiles of cancer phenotypes are directly connected to critical signalling pathways [20]. Nowadays, the effort continues regarding the various components of the extracellular and intracellular tumor microenvironment that contribute to the colorectal cancer phenotype [21-25]. MALDI-TOF MS has been used in combination with separation techniques for serum proteomic profiling and early diagnosis of colorectal cancer [26-28]. Comparison of the proteome changes between tumour and neighbouring normal colorectal mucosa is a common methodology employed to identify proteins that have altered abundance associated with tumorigenesis [29]. The ability of MALDI imaging to localize molecular changes within a tissue section at a cellular level and to allow for an accurate positive, differential and exclusion diagnosis of a given disease, can significantly improve the treatment of colorectal cancer [30]. MALDI imaging visualized two phospholipids as differentially expressed molecules in human colon cancer which metastasized to the liver, among which sphingomyelin (16:0) was found to be strongly expressed in the cancerous area [31]. MALDI-IMS analysis revealed characteristic phospholipid signatures in fresh-frozen colorectal tissue samples compared with healthy tissue and additionally, different tissue regions revealed distinct biochemical profiles [32]. More recently MALDI IMS uncovered a delicate and strict organization of lipid species within fresh frozen colorectal cancer biopsies [33]. Proteomic patterns derived by MALDI imaging analysis of fresh frozen tissue biopsies, have been used for accurate discrimination of colon cancer primary tumors, colon cancer liver metastases and hepatocellular carcinomas [34]. Some potential colorectal biomarkers have been reported using MALDI-IMS analysis of fresh-frozen colorectal cancer tissues [35]. In another study MALDI IMS revealed thymosin beta-4 as an independent prognostic marker for colorectal cancer [36].
The major disadvantage of using fresh-frozen tissues is the limited availability of tissues for which clinical follow-up data are available. Nowadays, research utilizing FFPE tissues, including proteomic applications, has become a topic of interest for analyses of clinical samples. Several studies have been published regarding the MALDI IMS analysis of FFPE tissues for cancer research [37-41]. The accumulation of FFPE archives, complete with patient clinical data greatly increases the number of clinical samples available for biomarker studies [42-44]. In addition, FFPE tissues can be easily stored at room temperature while retaining cellular morphology, removing much of the cost and difficulty of sample storage. Therefore methods and technologies that permit analysis of large numbers of such samples are essential. Several studies have been performed for the optimization of the heat-induced antigen retrieval (HIAR) protocols in different types of tissue samples to provide the best quality of proteomic imaging data [45-48]. However, it is currently well known that although these protocols are applicable to many tissue types, to achieve optimal results, the HIAR procedure for each different tissue type should be individually optimized [49-53]. Western blot analysis has also successfully detected several membrane-bound proteins and nuclear proteins from FFPE colorectal cancer tissues [54]. Western blot analysis has also been applied to the analysis of proteins in FFPE and frozen colorectal cancer tissues [55-56]. A streamlined filter-aided sample preparation workflow has been applied to the tandem-MS proteomic analysis of FFPE colorectal cancer tissues and retrieved several known colon cancer biomarkers [57]. Recently, tandem Mass Tag protein labelling followed by digestion and chromatographic separation was used to identify and quantify proteins extracted from FFPE colorectal cancer and normal tissues [58]. In another study, FFPE tissues of different tumors were processed with three different processing systems and then subjected to MS-based proteomic analysis to investigate the impact of tissue processing techniques on the quality of proteomic analysis [59]. Recently an simple in situ pretreatment technique for preparing FFPE sections that involves high pressure and temperature has been applied to the MALDI-IMS analysis of FFPE colon carcinoma tissues using 2,5-dihydroxybenzoic acid matrix [60]. Given these developments in the use of FFPE tissues for characterization of tumors, the employment of a MALDI-IMS method in positive linear mode over the mass per charge (m/z) range of 2000-20000 to analyze FFPE colorectal cancer tissue biopsies would be of great clinical value.
To the best of our knowledge it is the first time that a multivariate statistical approach based on sequential PCA analysis is proposed for a direct tissue correlated proteome analysis of FFPE tissue samples from colorectal adenocarcinoma biopsies using MALDI IMS. We processed FFPE samples by using a HIAR procedure to restore normal protein composition and increase the signal and the number of mass ion peaks detected with MALDI-IMS [45]. MALDI IMS spectral data obtained from tumor and paired healthy tissue sections were submitted to sequential PCA analysis and 2-D distribution tests to identify differentiating mass ion peaks between non-tumor and tumor tissue section samples. The process of evaluating multivariate data obtained from MALDI IMS using principal component analysis allows for the straightforward differentiation of samples [61-64]. PCA analysis reduces the dimensionality of the data set to a 2D or 3D coordinate system, in which each sample (spectrum) is represented by a point, spectra with similar variation characteristics can be clustered together and the differences between sample groups can be readily visualized in the system. The results of this study underline the vast potential of MALDI-IMS in combination with principal component analysis to detect molecular patterns suitable to distinguish between tumor and paired healthy (normal) colon tissues. These specific and statistically significant ion peaks may serve as potential biomarkers for colorectal adenocarcinoma in FFPE and fresh frozen tissue section samples.
Experimental section
Materials
All solvents used were of HPLC grade and purchased from E. Merck (Darmstadt, Germany). Xylene was of analytical reagent grade and purchased from J.T. Baker (Phillipsburg, NJ, USA). Disodium hydrogen phosphate, sodium dihydrogen phosphate, ethylene diamine tetra acetic acid disodium salt and Tween 20 of analytical reagent grade were purchased from Sigma-Aldrich (St Louis, MO, USA). Conductive indium tin oxide (ITO)-coated glass slides and peptide calibration standard II were purchased from Bruker Daltonik GmbH (Billerica, MA, USA). Sinapinic acid (SA) and α-cyano 4-hydroxycinnamic acid (HCCA) were purchased from Sigma-Aldrich (St Louis, MO, USA).
Patient samples
All solvents used were of HPLC grade and purchased from E. Merck (Darmstadt, Germany). Xylene was of analytical reagent grade and purchased from J.T. Baker (Phillipsburg, NJ, USA). Disodium hydrogen phosphate, sodium dihydrogen phosphate, ethylene diamine tetra acetic acid disodium salt and Tween 20 of analytical reagent grade were purchased from Sigma-Aldrich (St Louis, MO, USA). Conductive indium tin oxide (ITO)-coated glass slides and peptide calibration standard II were purchased from Bruker Daltonik GmbH (Billerica, MA, USA). Sinapinic acid (SA) and α-cyano 4-hydroxycinnamic acid (HCCA) were purchased from Sigma-Aldrich (St Louis, MO, USA).
Sample collection and preparation
The tissue samples were taken from patients who had been diagnosed with colorectal cancer and who were undergoing definitive surgical resection of the primary tumor, according to the standard local therapeutic protocol. Tissues samples were collected, both from the adenocarcinoma tumor, and from non-affected areas of the colon. Hematoxylin and eosin staining of tissues, evaluation of pathology and formalin fixed paraffin embedded (FFPE) preparation were all performed by board certified surgical pathologists. The pathologist microscopically demarcated areas in the stained tissue that histologically appeared consistent with carcinoma cells and un-affected areas. A portion of the resected tissue tumor and normal did not undergo paraffin fixation. The unfixed samples were prepared by snap-freezing in liquid nitrogen. These samples were stored at -80ºC until the analysis.
Fresh-frozen tissue samples were cryosectioned at a thickness of 7 μm and placed directly onto ITO (Indium Tin Oxide) one-side coated conductive glass slides using a Leica CM3050 S cryostat operated at -25ºC. Each slide contained one tumor and one normal section. Tissue samples were dried under vacuum for 60 min then washed twice in 70 % and 100% ethanol, respectively for 0.5 min. Samples were then stained with 0.25% w/v toluidine blue for 0.5 min and subjected to additional drying under vacuum for 30 min. Slides were scanned to document the position of the tissue. Three orientation points were set near the tissue sections. The remainder of the resected specimen underwent fixation for preservation and storage. FFPE samples were fixed in 10% buffered formalin for 24 h, at room temperature, dehydrated with ethanol and paraffin-embedded according to the standard local protocol.
FFPE samples were cut into 7μm tissue sections using a Leica RM2125RT microtome operated at room temperature. Tissue section FFPE samples (one tumor and one normal section per slide) were then applied onto ITO one-side coated, conductive glass slides and kept at 60ºC overnight to facilitate adhesion of the section to the target. The paraffin was removed with xylene washes twice for 20 min each before hydration with graded ethanol washes (100% EtOH, 1×10 min; 95 % EtOH for 5 min; 80 % EtOH for 5 min, and 70 % EtOH for 10 min). After fully drying for one hour in an oven at 65oC, the samples were immerged into a pre-heated steamer containing Tris-EDTA buffer pH = 8.4 at 95ºC for 40 min. After cooling at room temperature for 20 minutes the samples were rinsed once with PBS Tween 20 for 10 min, and twice with distilled water for 5 min each. A 0.5 % toluidine blue solution was then applied for 1 min. The samples were dried under vacuum for 30 min before matrix application.
Matrix application
The Image Prep (Bruker Daltonics) was used for matrix application of either SA (10 mg/mL in ACN/H2O 60/40 v/v, 0.2 % TFA) or HCCA (10 mg/mL in ACN/H2O 60/40 v/v, 0.2 % TFA) as matrices. Spraying was accomplished using the ImagePrep standard programs.
MALDI-IMS analysis
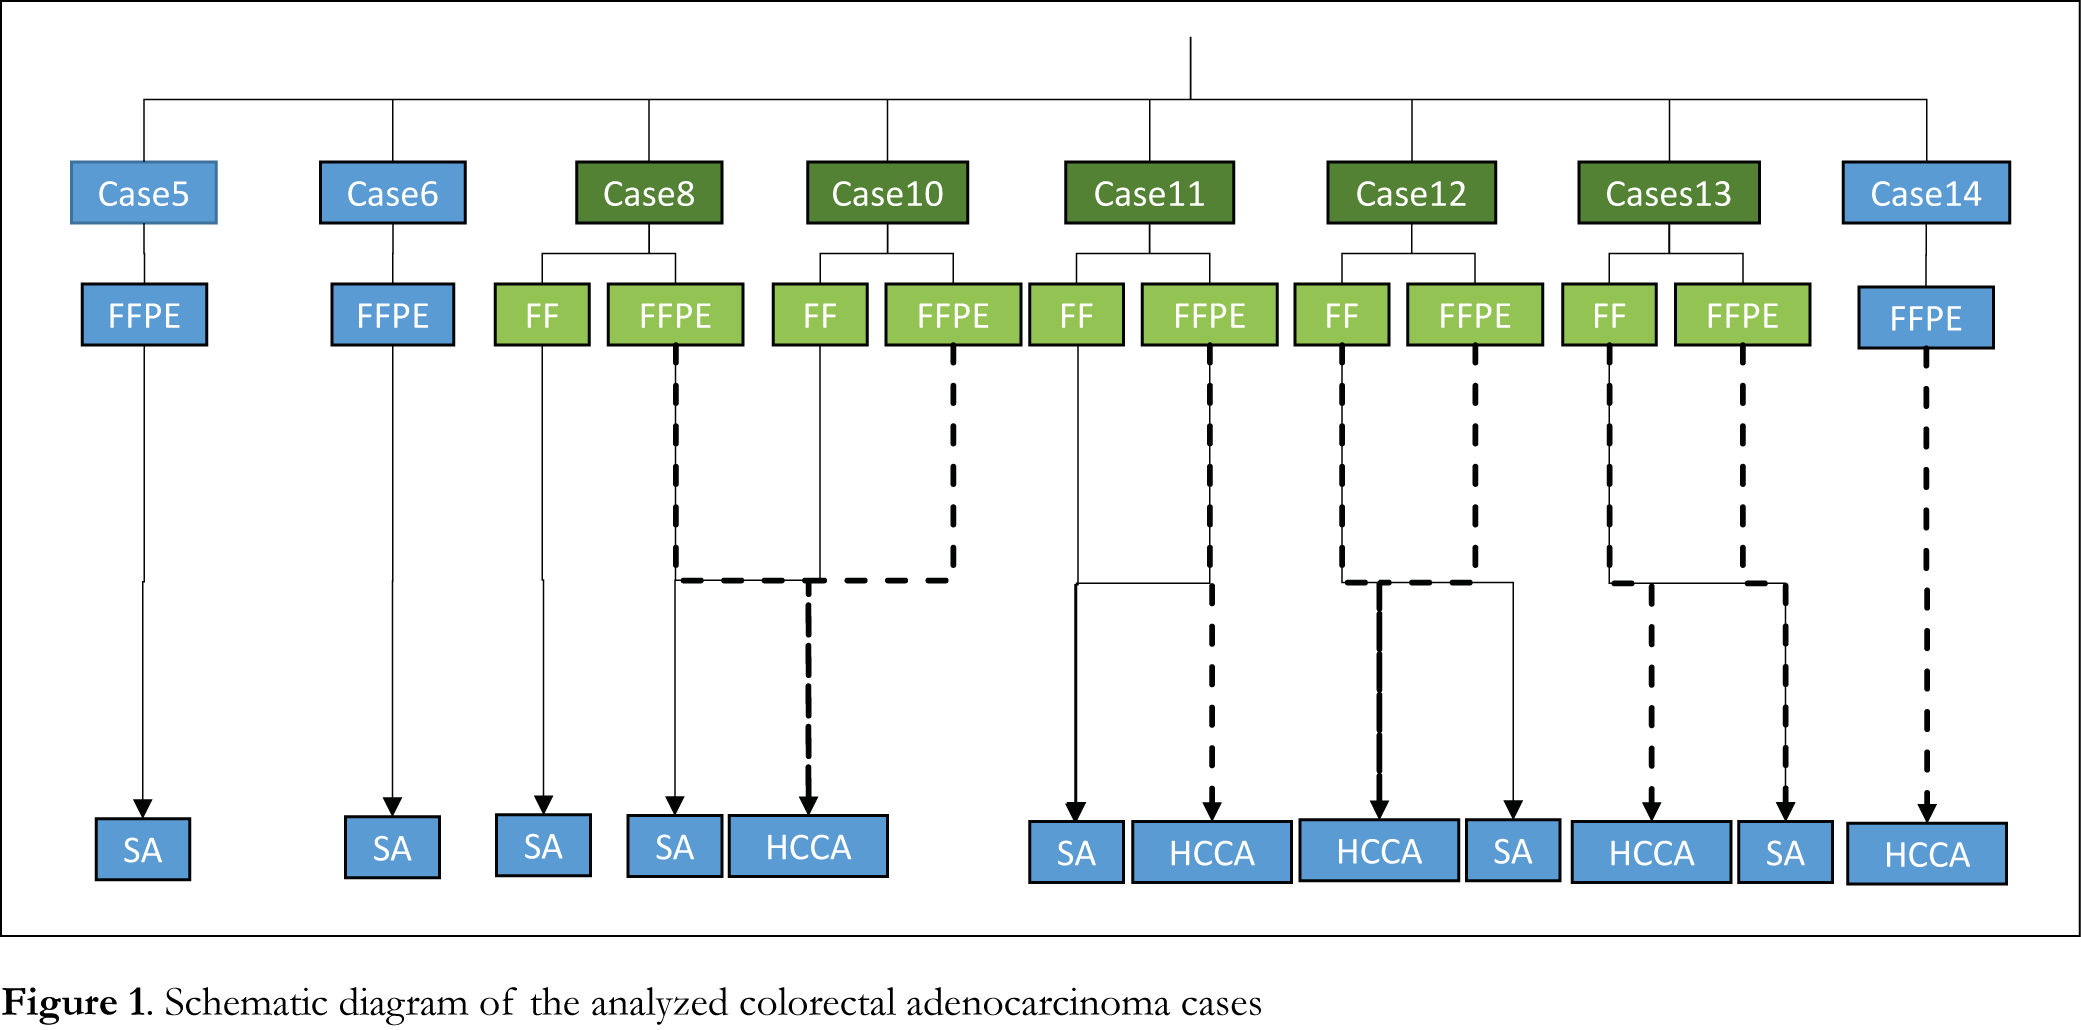
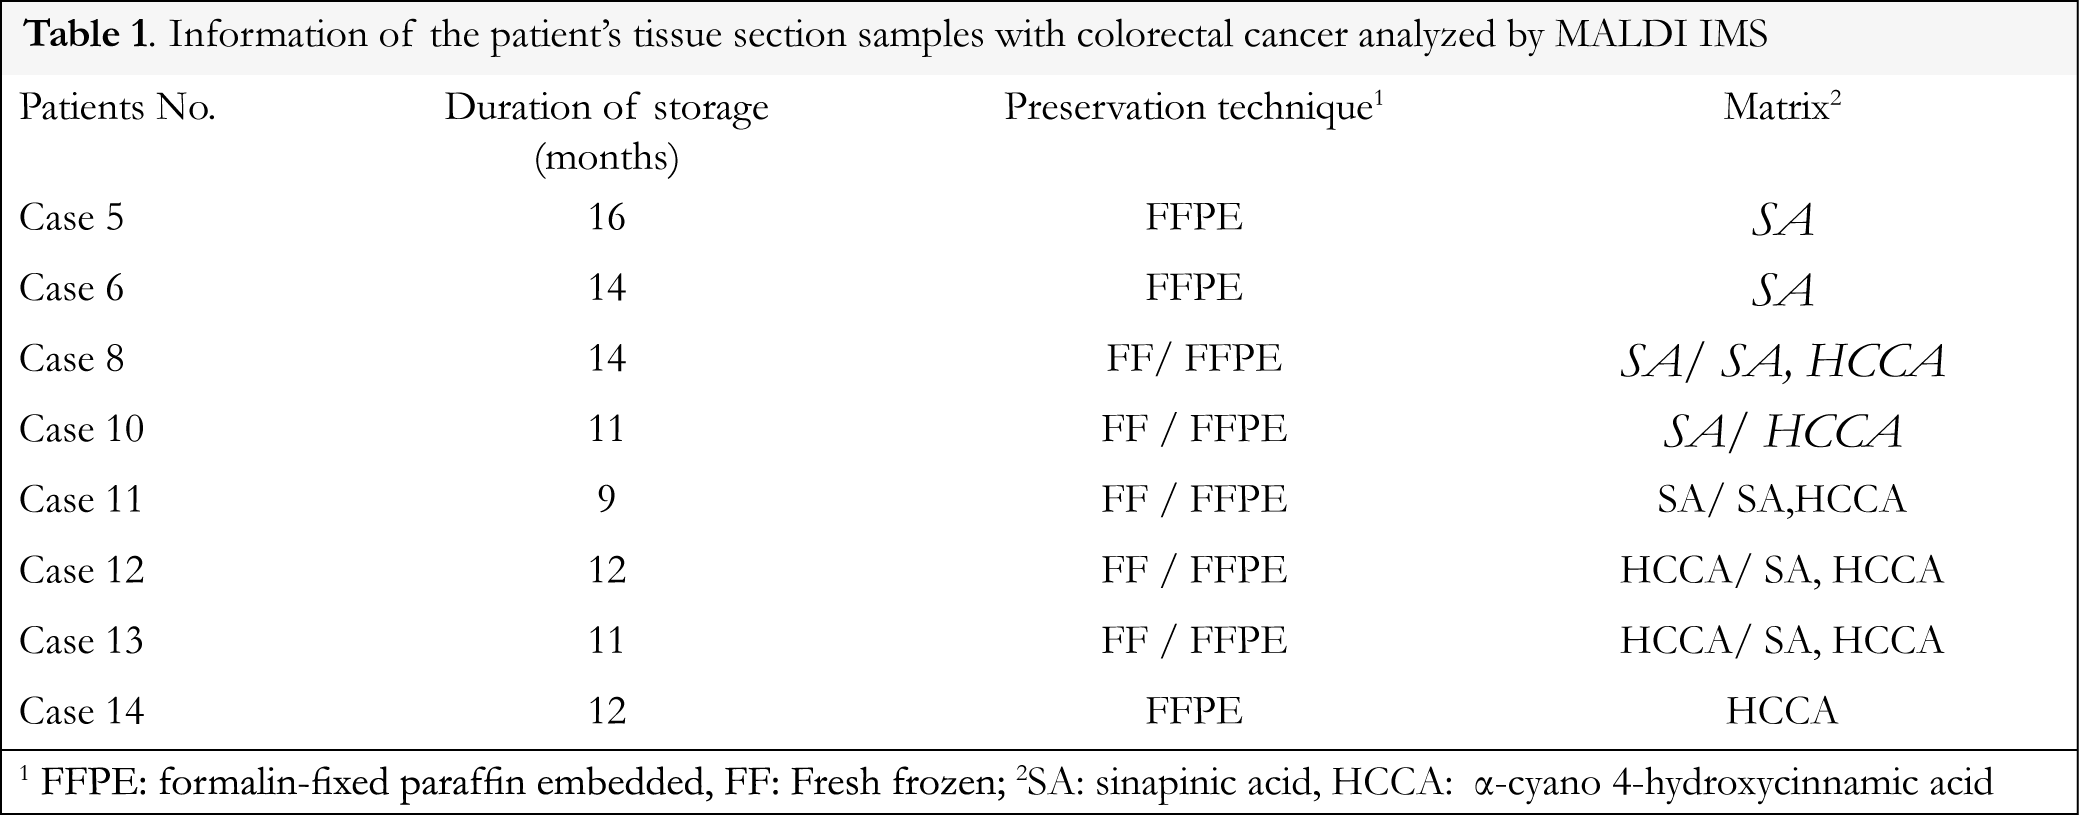
Eight colorectal adenocarcinoma cases that were stored for 9 to 16 months after FFPE procedure were analyzed using MALDI IMS and data were compared to normal areas of the same tissue stored under the same fixation procedure. Fresh frozen samples of tumor and normal areas were also analyzed for comparison. Information of the patients’ tissue section samples with colorectal cancer analyzed by MALDI IMS is presented in Table 1. A schematic diagram of the analyzed colorectal adenocarcinoma cases is presented in Figure 1.
Spectra were collected across selected tissue areas that were arbitrarily selected within the regions that the pathologist defined as tumor and normal, using the Ultraflex III MALDI-TOF/TOF instrument (Bruker Daltonics) with a SmartBeam laser operating at 100 Hz in linear positive mode over a mass range of m/z 2000 to 20000. A laser spot diameter of 100 μm and a raster width of 100 μm were used. Using the FlexImaging software (Bruker Daltonics), orientation points were generated to ensure the correct positioning of the laser for spectral acquisition. The software exported the specific geometry of the tissue to be analyzed, and an instrument-specific automated method was created, which generates a grid across the tissue of spots upon which data were acquired. Calibration was done externally using a protein standard mixture in the mass range of m/z 3000 to 16500. The intensity of each scan, over the entire mass range acquired, was mapped on to the tissue section image, allowing the visualization of the location of each m/z detected. These images were generated and visualized using FlexImaging software.
Data processing and analysis
In this work FlexImaging software was used to compare the different MS spectra macroscopically. The spectra were then imported into the ClinProTools software for post-processing and generation of proteomic profiles. A resolution of 800 was applied to the peak detection method. The Convex Hull baseline with a flatness value of 0.8 was selected for baseline subtraction. Savitsky Golay algorithm was applied with a width of 2 m/z in 5 cycles for spectral smoothing. Null spectra exclusion filter was enabled with a noise threshold of 2, to exclude spectra with no data or extremely low intensities. Mass recalibration was not performed. PCA Analysis was managed by an external MATLAB software tool, which is integrated in ClinProTools. This software calculates p-values for the mass ion peaks of tumor and normal regions. The peak of the lowest p-values was selected as the best discriminatory marker as a low p-value describes the importance of a single peak in a group. The 2D Peak Distribution view displays the distribution of two selected peaks in the non-excluded spectra of the loaded model generation classes. The peak numbers and m/z values are indicated on the x- and y-axes. The signal pattern of molecular ions was acquired from tumor and healthy regions and only peaks with p-values less than 0.05 by one-way ANOVA were selected for evaluation.
Results
MALDI-IMS analysis
Tissue samples of tumor and normal sections obtained from 8 colorectal adenocarcinoma patients were used for MALDI imaging. MALDI TOF spectra were acquired directly on colon tissue sections using fresh-frozen or FFPE tissue section samples. FFPE tissue section samples were processed using a heat induced antigen retrieval (HIAR) procedure that increased the signal and consequently the number of mass peaks detected in MALDI IMS.
Figures and Tables


[Click to enlarge]
Multivariate analysis of MALDI IMS spectra
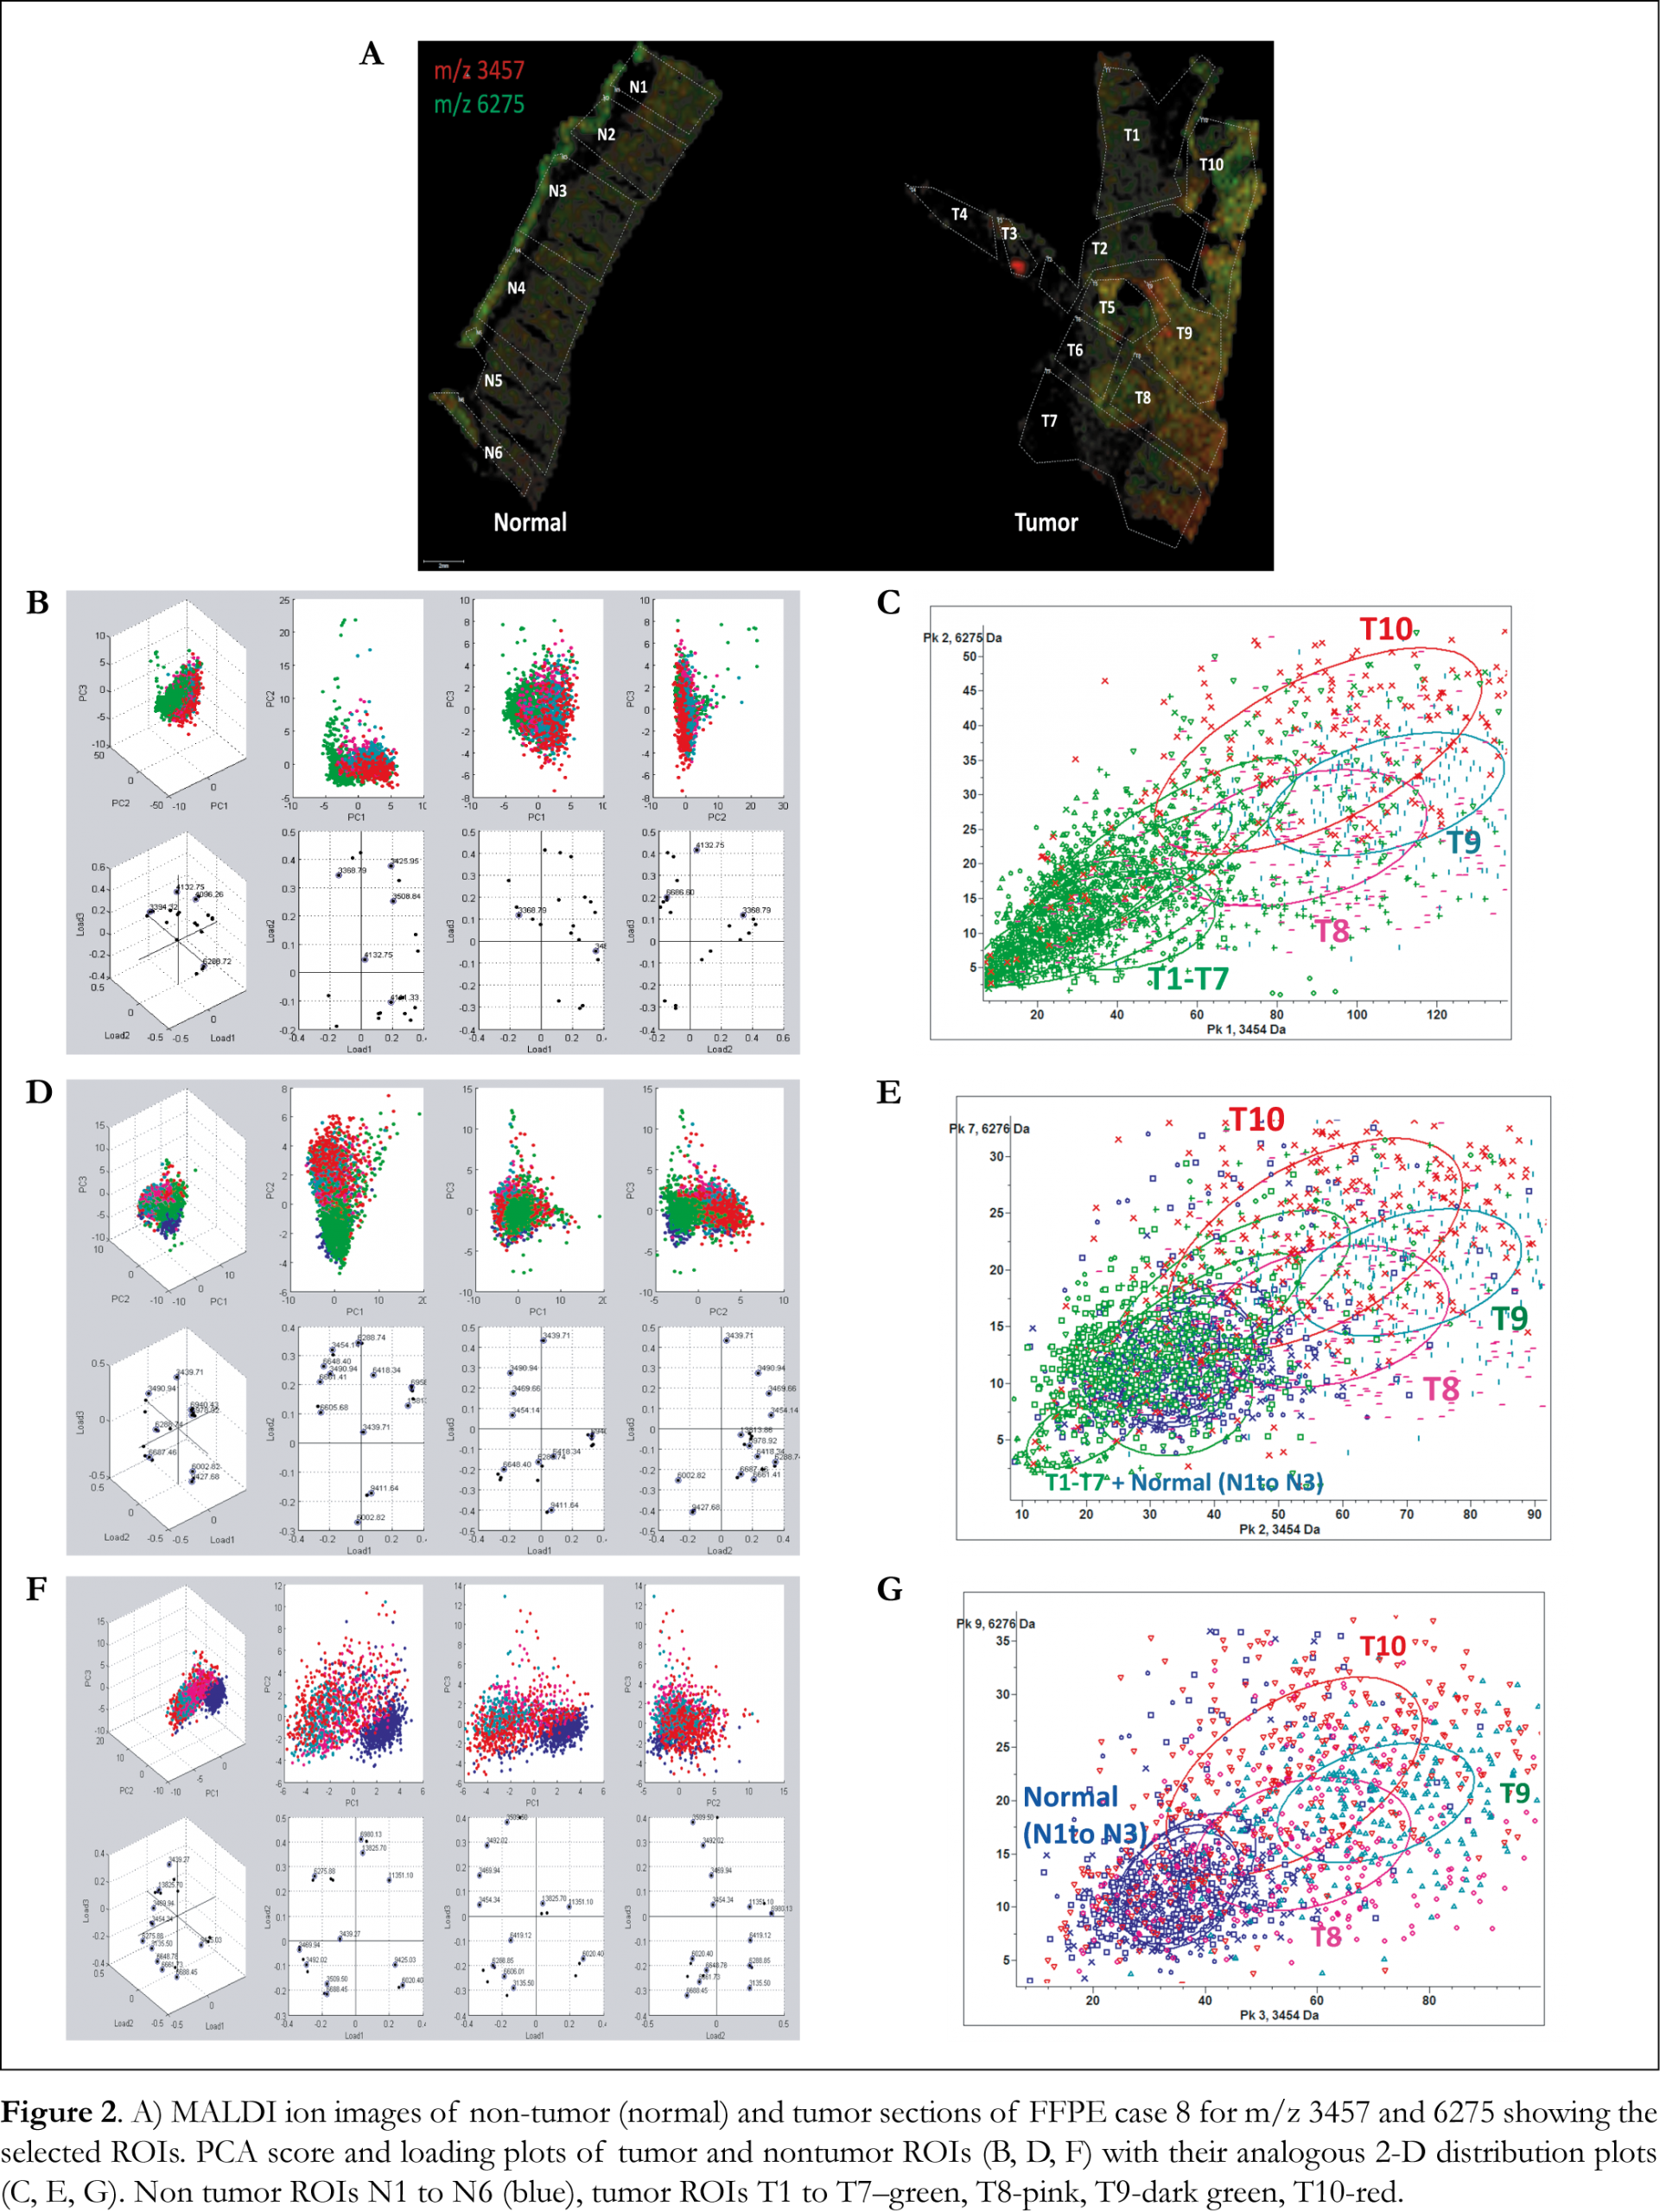
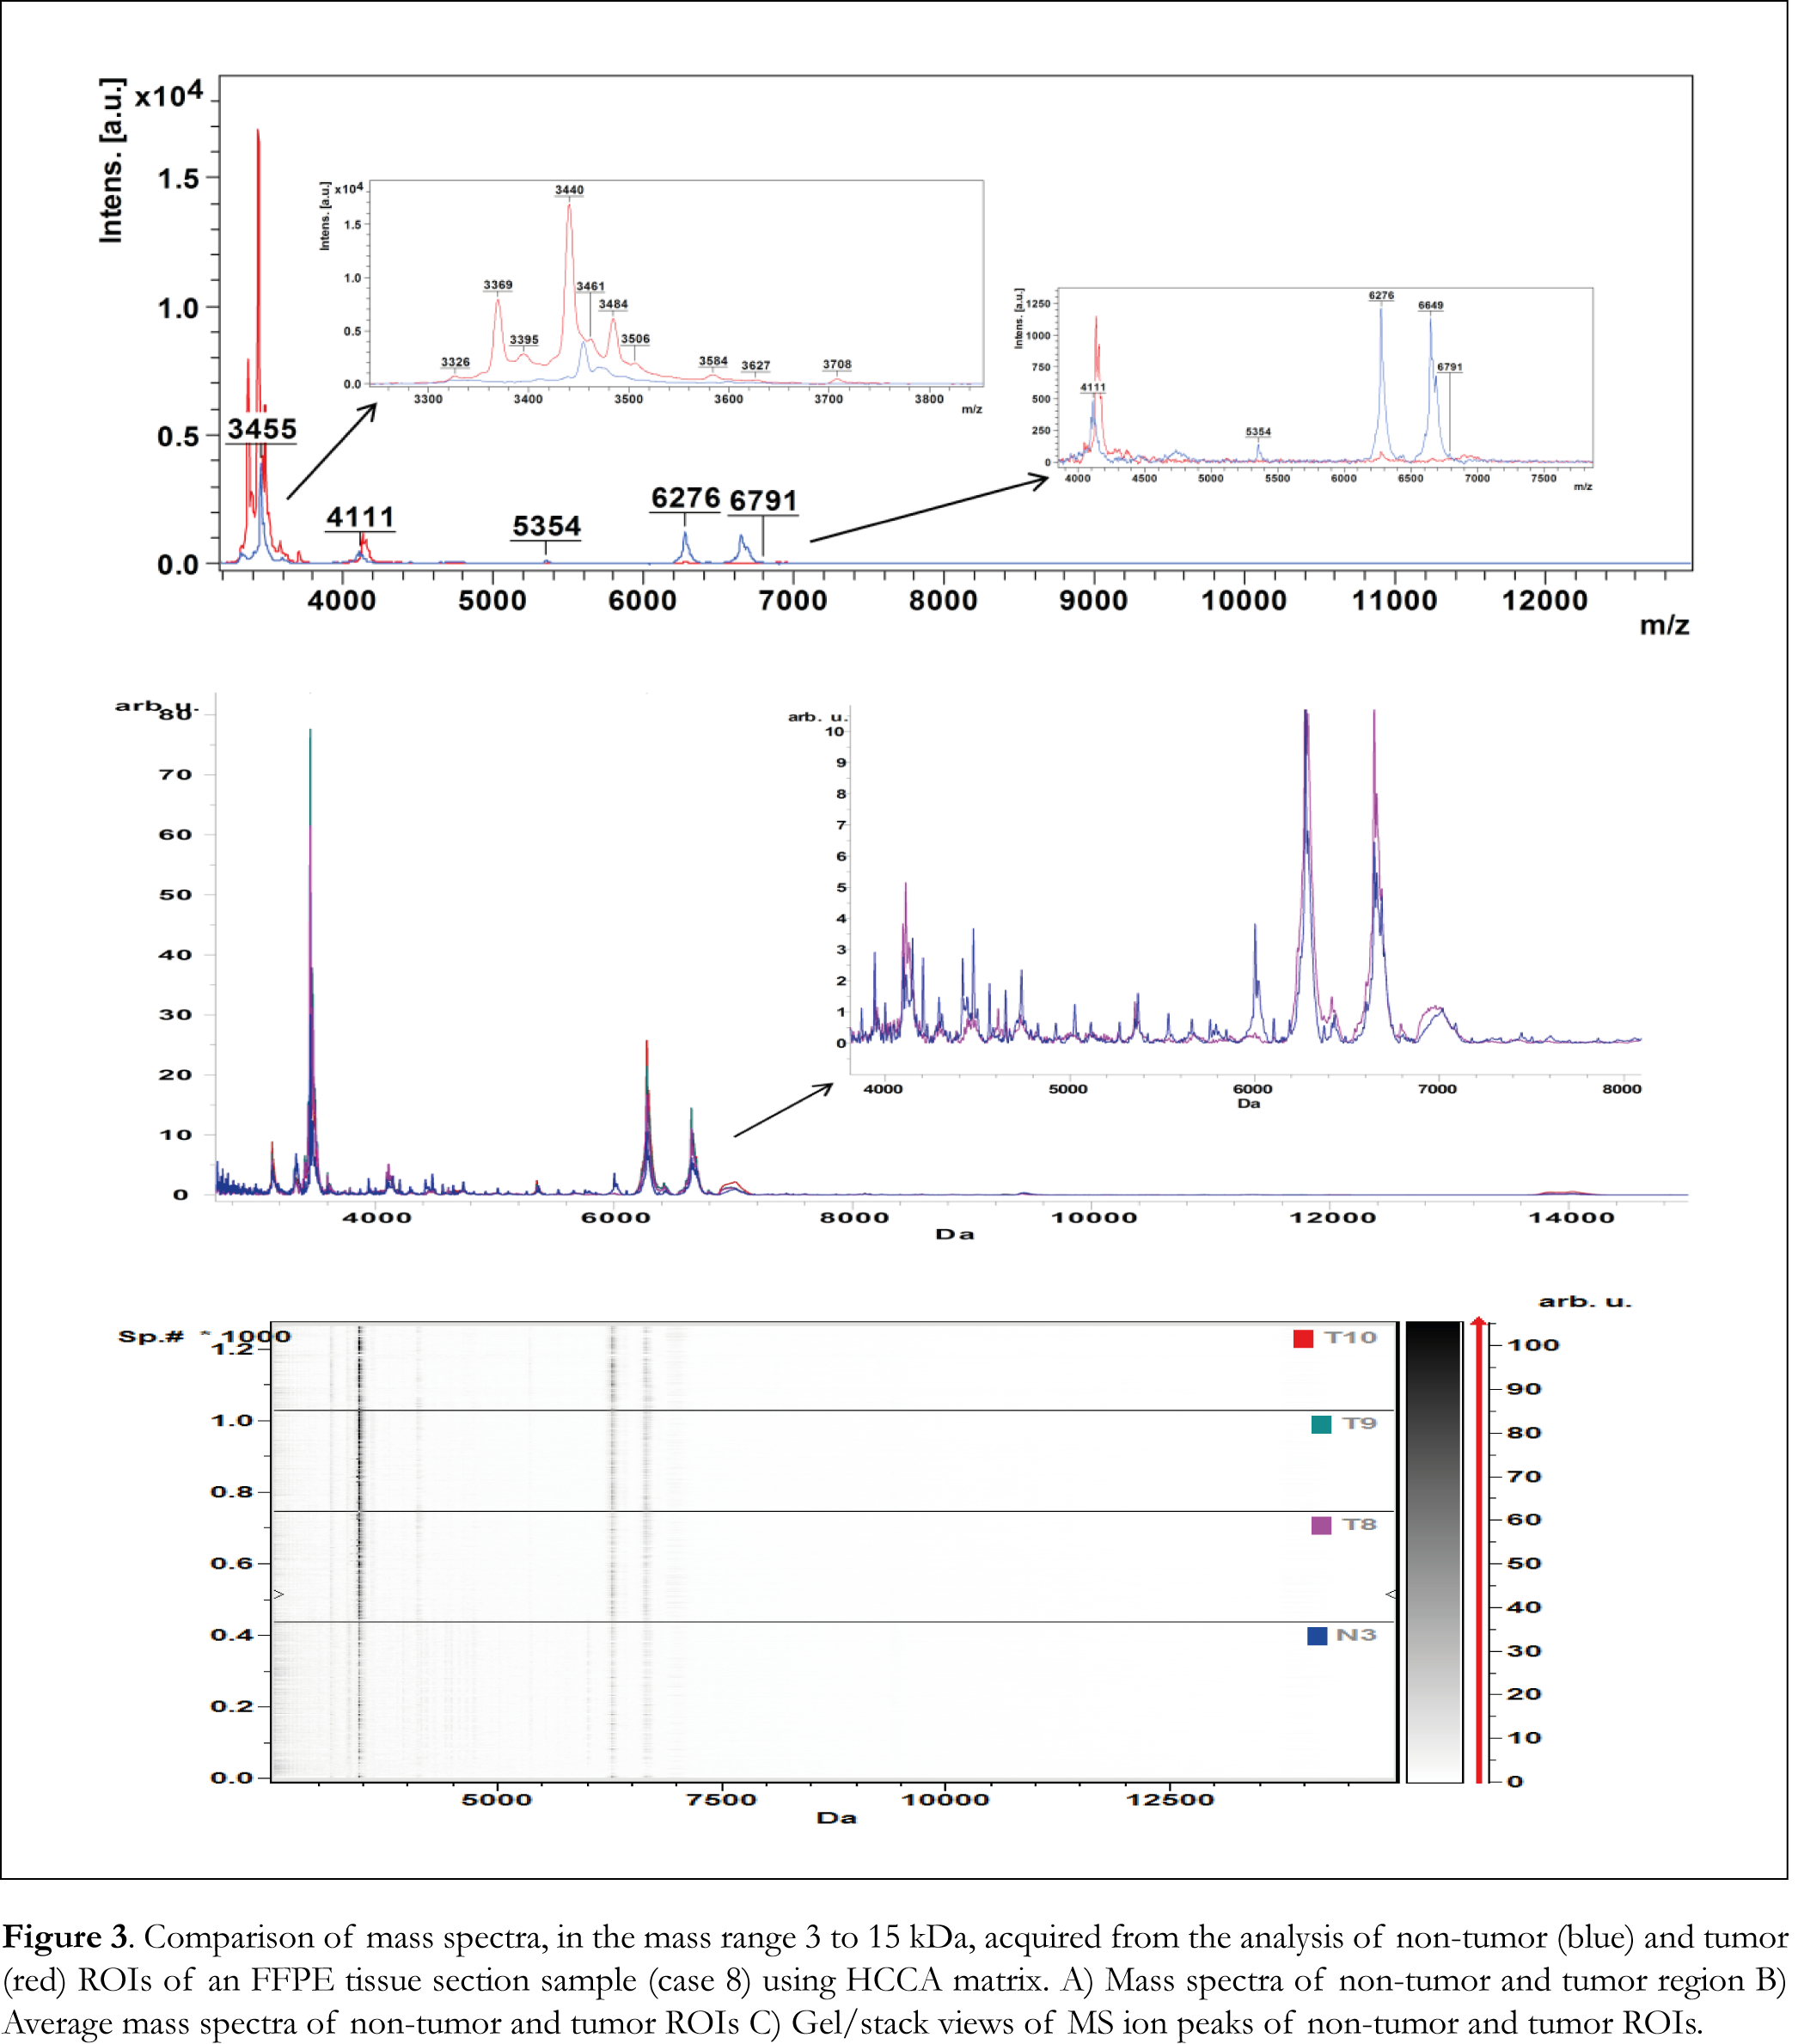
MALDI IMS spectra collected from each tumor and normal tissue section sample were split arbitrarily into different regions of interest (ROIs) and exported to ClinProTools software for the statistical analysis. PCA analysis calculated the variances between tumor, the adjacent normal regions within a given specimen and normal tissue sections. Ion images of tumor and normal tissue sections of FFPE case 8 are presented in Figure 2A with highlighted the ROIs that were used to perform PCA analysis and 2-D distribution tests. Ten ROIs were arbitrarily outlined in the tumor tissue section and six ROIs were outlined in the normal tissue section. PCA analysis revealed a series of significant ion peaks that account for the variation between tumor and normal ROIs. Score and loading outputs obtained from PCA analysis of tumor ROIs (T1 to T10) are presented in Figure 2B. The score outputs demonstrated distinction between tumor ROIs T8, T9 and T10 and ROIs T1 to T7 in the three principal component (PC) coordinates. This distinction is also revealed in 2-D peak distribution plot presented in Figure 2C. PCA analysis was able to determine peaks that differentiated tumor ROIs T8, T9 and T10 from tumor ROIs (T1 to T7) and normal ROIs (N1 to N3) as it is illustrated in the score and loading outputs presented in Figure 2D and the 2-D distribution diagrams presented in Figure 2E. PCA analysis (Figure 2F) between tumor ROIs T8, T9 and T10 and normal ROIs (N1 to N3) revealed a series of significant ion peaks that account for the variation between tumor and normal ROIs. As it is shown in the 2-D peak distribution diagram in Figure 2G, tumor ROIs T8, T9 and T10 demonstrated distinction in intensity and distribution pattern compared to the rest of the spectral data. Mass spectra obtained from flexAnalysis, average mass spectra of the selected ROIs and pseudo-gel view of mass ion peaks obtained from PCA analysis, all in the mass range 3 to 15 kDa, are presented in Figures 3A, 3B and 3C, respectively. Several mass ion peaks demonstrated distinction between tumor and normal ROIs and revealed the heterogeneity of tumor tissue sections.
Multivariate data analysis of tumor and normal ROIs was repeated in all 8 cases analyzed in this work using FFPE and fresh frozen tissue section samples. PCA analysis and 2-D distribution tests of tumor and normal ROIs revealed specific peak patterns of ion peaks that were overexpressed in colorectal adenocarcinoma. These ion peaks have been ranked according to their intensity using p-value t-test analysis of variance (ANOVA), and the mass ion peaks with p-values less than 0.05 have been selected to distinguish cancerous colon tissue from normal colon tissue.
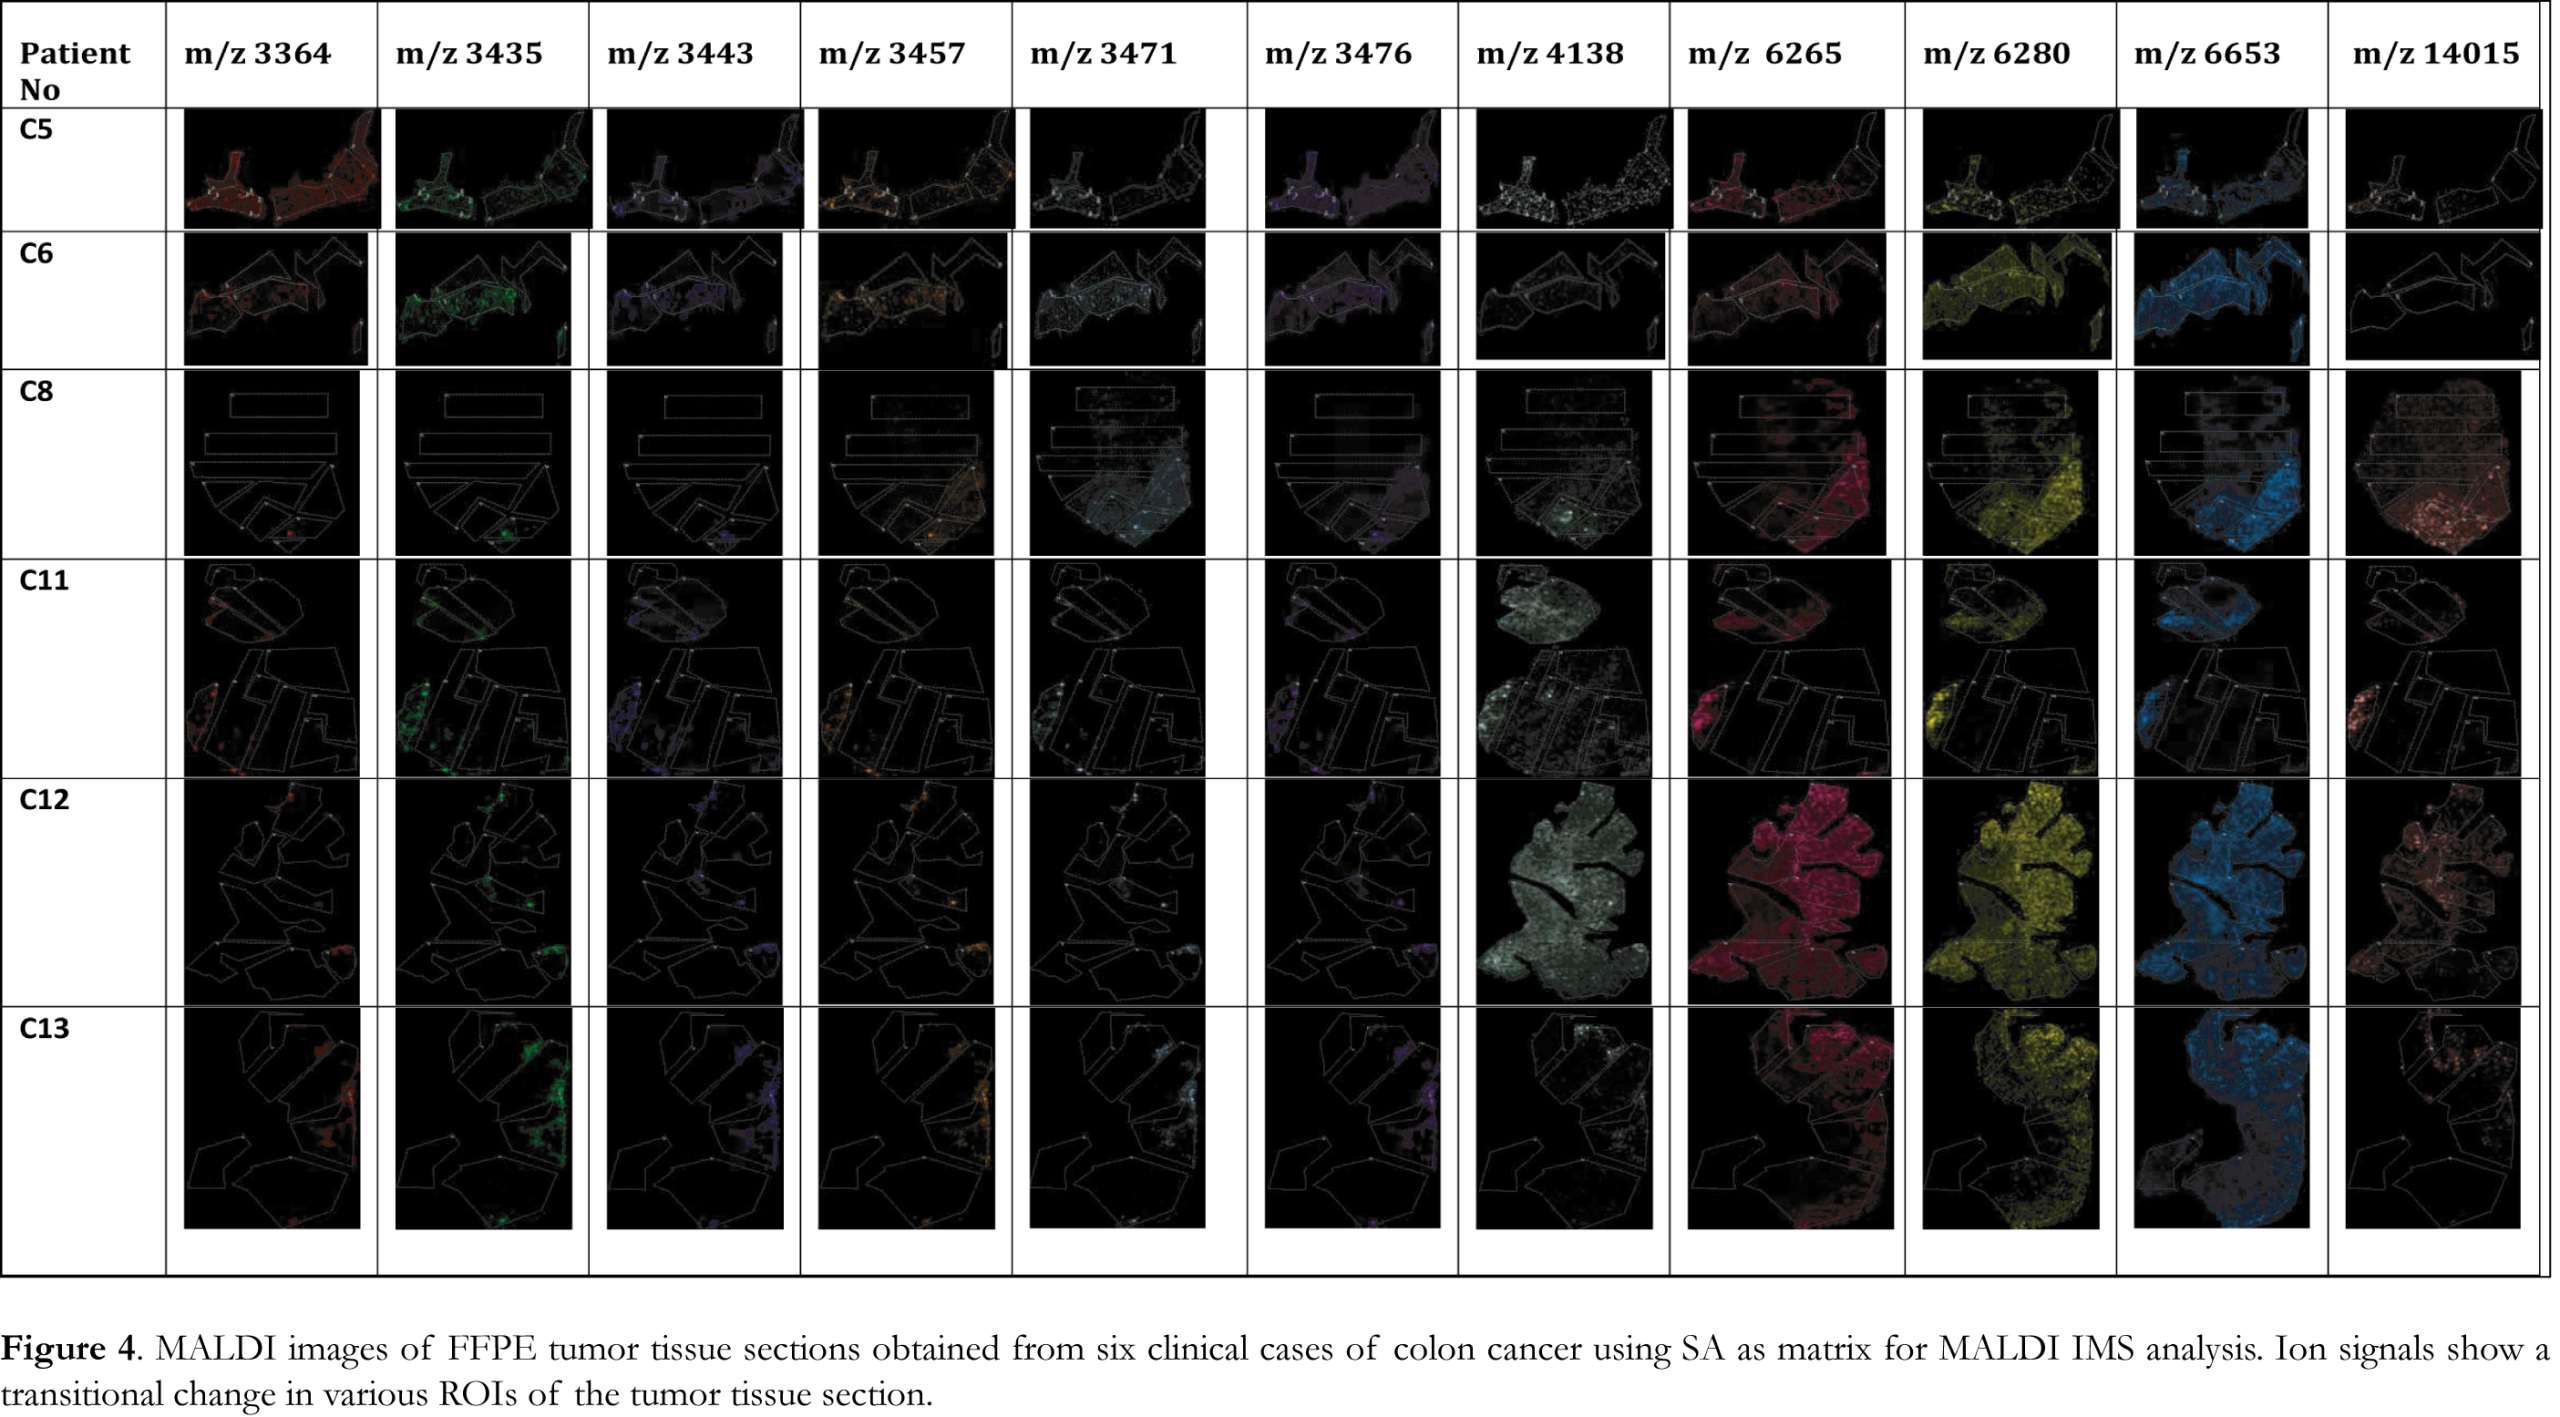
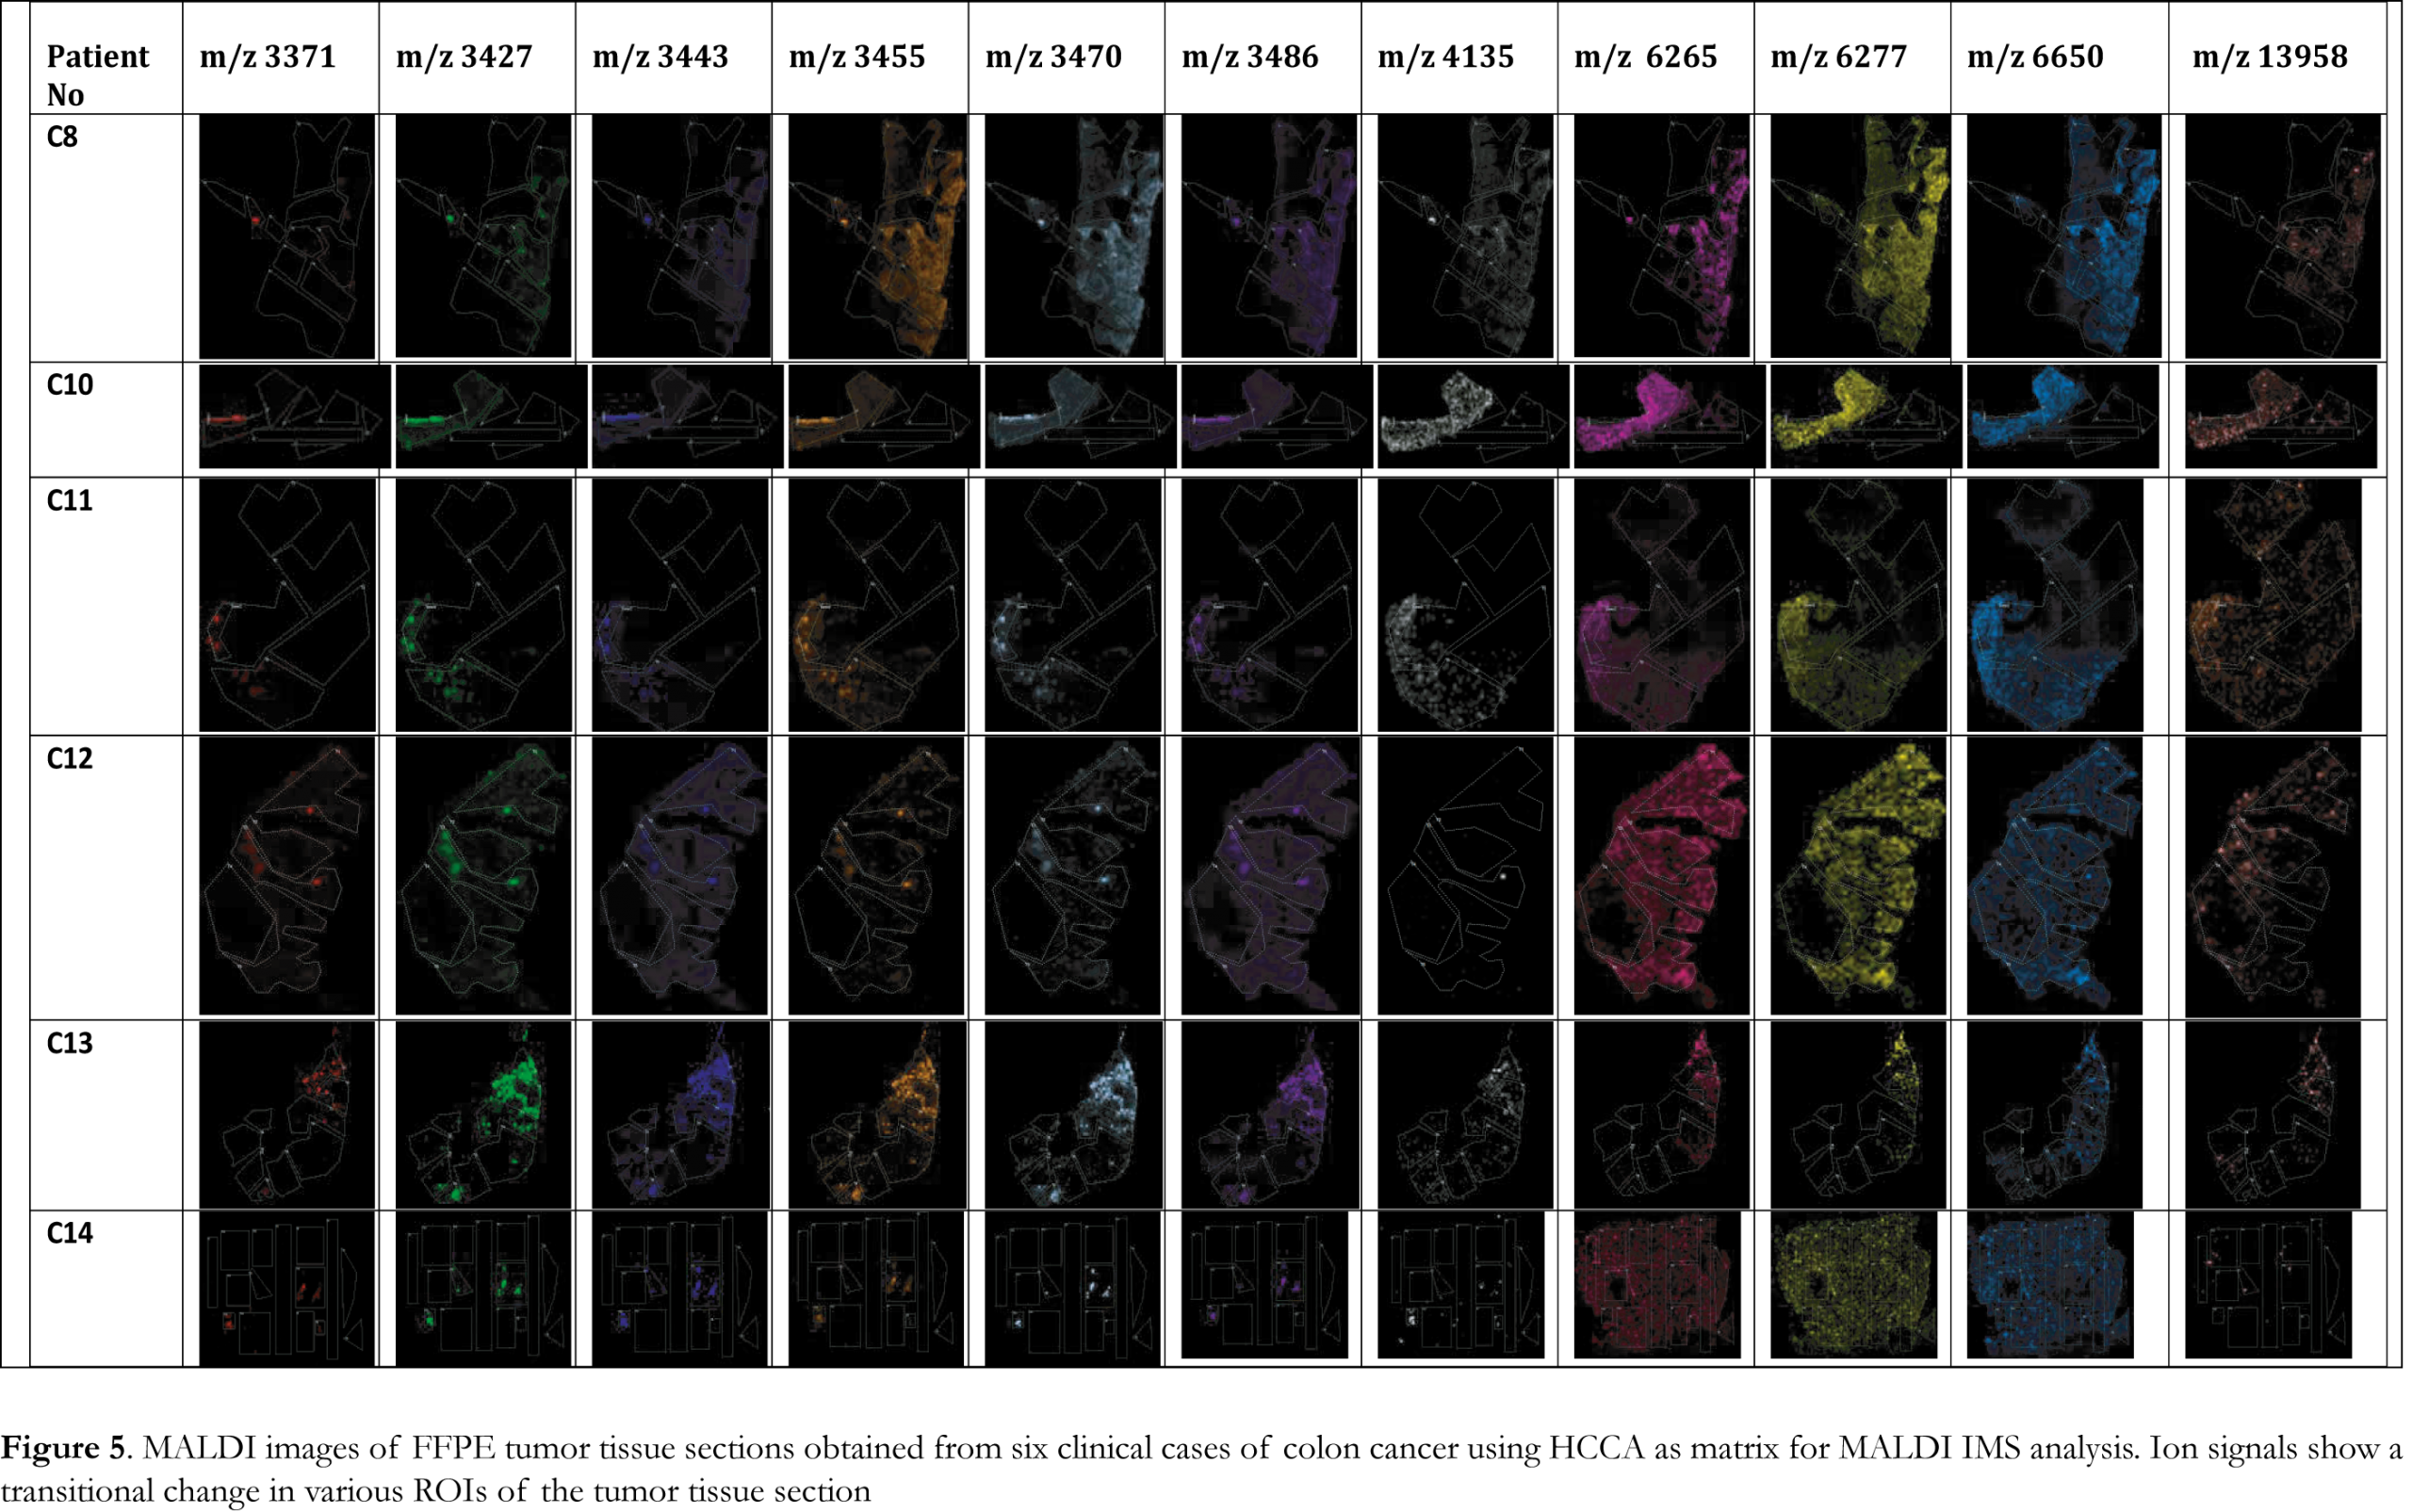
MALDI IMS collects sequential spectra from spots over the entire tissue section and information on spatial distribution of all the biomolecules can be obtained. To identify changes in the distribution of biomolecules at a spatial level, the significant ion peaks selected by PCA analysis were mapped on the tissue sections to visualize their distribution and relative abundance. Ion images, presented in Figure 4, of the FFPE tissue section samples analyzed by MALDI IMS using SA matrix were able to visualize the tumor areas in the analyzed samples. For all the six cases analyzed using SA matrix a specific peak pattern of ion peaks with m/z values of 3364, 3435, 3443, 3457, 3471, 3476, 4138, 6265, 6280, 6653 and 14015 was revealed. The spatial distribution of each of these ion peaks illustrated significant changes in intensity and varying distribution patterns among the different ROIs. These ion peaks account for the difference between tumor and normal ROIs and the ion images were able to visualize the tumor areas in the analyzed samples. When HCCA was used as matrix for MALDI IMS a specific peak pattern of ion peaks with m/z values of 3371, 3427, 3443, 3455, 3470, 3486, 4135, 6265, 6277, 6650 and 13958 was revealed. These significant ion peaks were able to discriminate between tumor and normal ROIs as it is illustrated in the ion images presented in Figure 5. HCCA seems to illustrate better the transitional change in the spectral intensity of the significant ion peaks and thus discriminate between tumor and healthy ROIs.
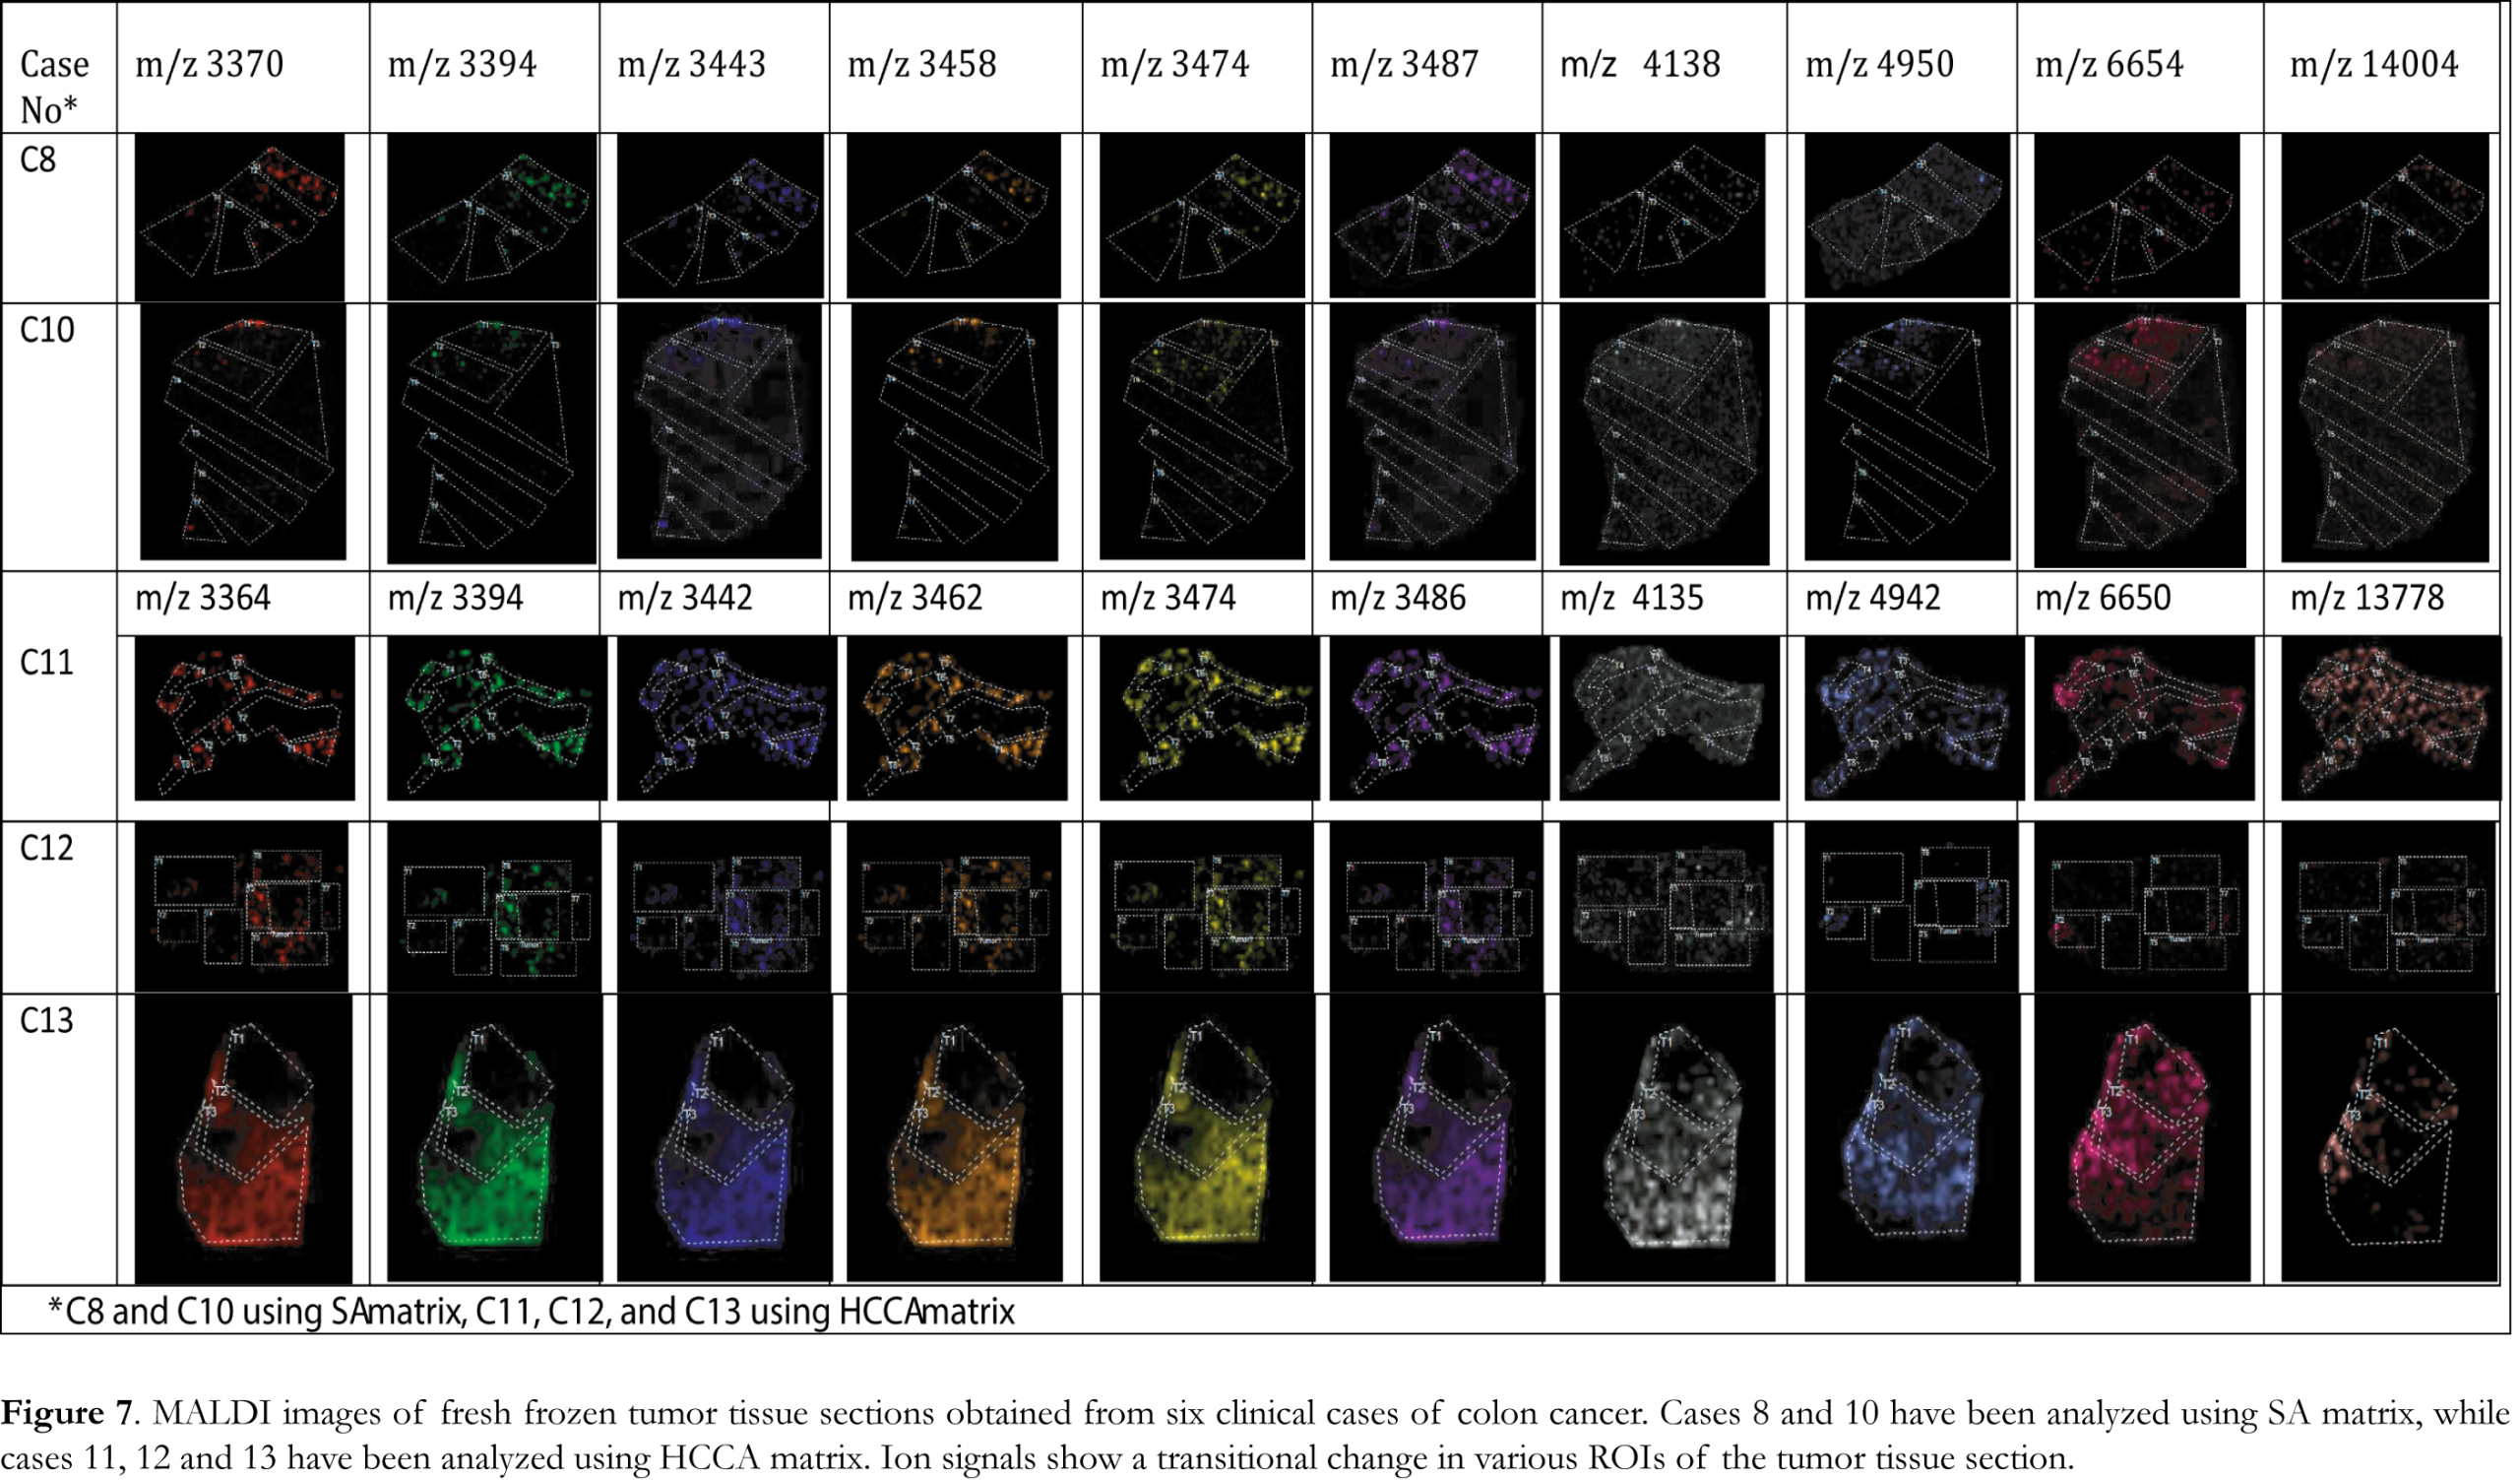
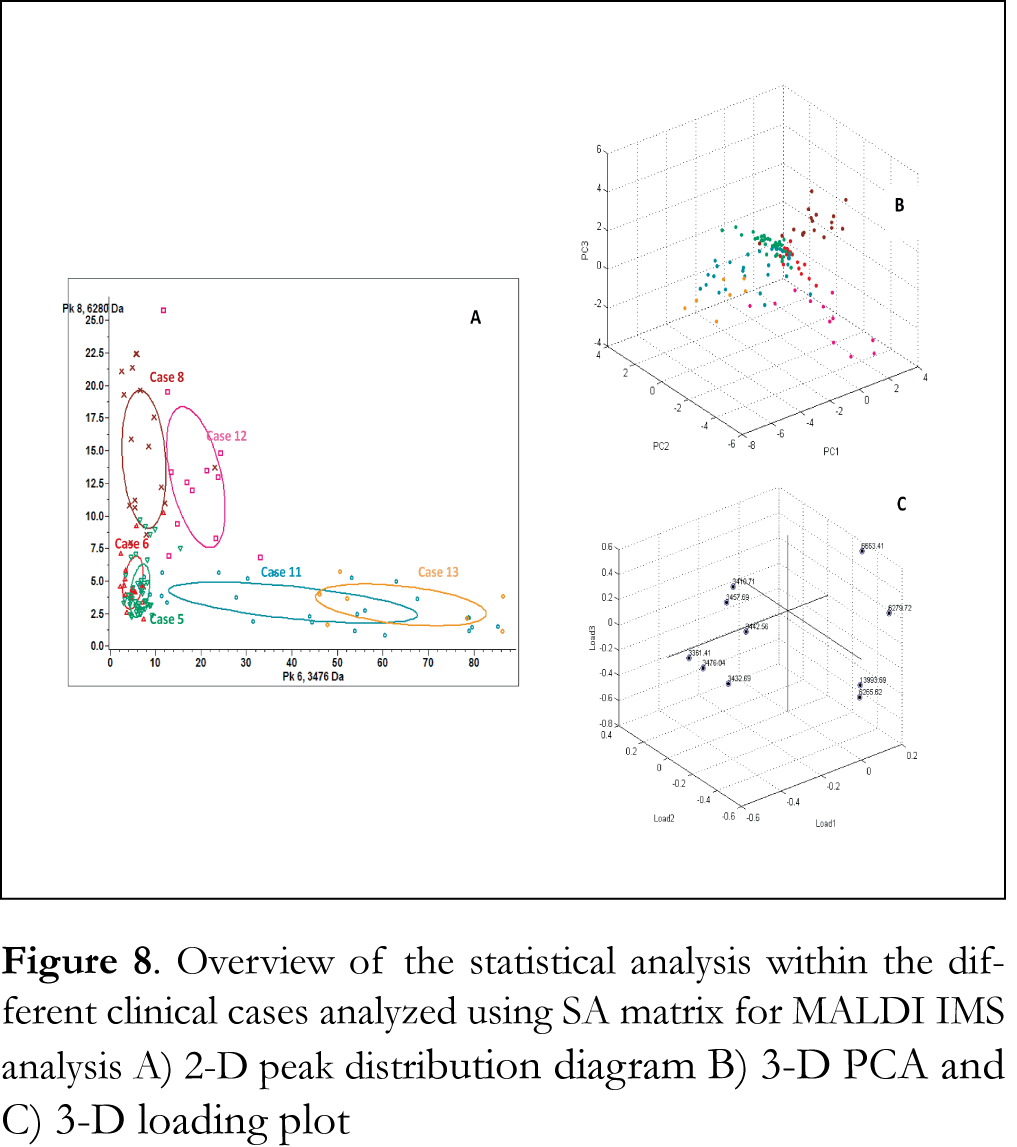
Figure 6A shows overlaid MALDI mass spectra recorded from the analysis of tumor tissue section of case 8 using fresh-frozen and FFPE tissue section samples and SA matrix. Clearly observable in these data is that MALDI IMS analysis of fresh frozen tissue section samples leads to analogous peak patterns of mass ion peaks to that of FFPE tissues. Average mass spectra of tumor ROIs of case 8 using fresh-frozen and FFPE tissue section samples and SA matrix are presented Figure 6B. These findings verify that the HIAR procedure can be used to procure the proteomic profile from FFPE colon adenocarcinoma tissue with similar reliability as fresh frozen tissue. Ion images of fresh frozen tissue section samples obtained using the significant mass ion peaks that are able to discriminate tumor regions are presented in Figure 7. Tumor ROIs in tissue section samples were acquired using sequential PCA analysis, as described above. Spectra of these tumor ROIs have been exported and combined using ClinProtSpectralimport XML generator prior to statistical analysis. PCA was able to reveal significant mass ion peaks that were then used to visualize the variability within the different clinical cases analyzed using either SA or HCCA as a matrix. The 2-D distribution diagrams have been constructed using the two most significant peaks that distinguish between the different tumor ROIs. The x- and y-axes in these diagrams stand for intensities of the two best discriminating peaks. The 2-D peak distribution diagrams, the 3-D PCA plot and the 3-D loading plots of tumor ROIs obtained from the analysis of FFPE tissue section samples using either SA or HCCA as a matrix are presented in Figures 8 and 9, respectively. Statistical analysis revealed a clear separation of the clinical cases analyzed using either SA or HCCA as matrix. As the distribution pattern of the cases 8, 11, 12 and 13 that have been analyzed using both matrices is similar we concluded that both matrices can be used for MALDI IMS analysis of FFPE tissue section samples. Ultimately, HCCA was the best choice with regard to spectral intensity in most of the clinical cases analyzed in this study.
Discussion
The MALDI IMS technique employed in this study demonstrates the ability to effectively analyze FFPE and fresh frozen colorectal adenocarcinoma tissue section samples. The results are reproducible among the different cases, independent of the storage condition of the tissue, fresh frozen or FFPE. Thus, the HIAR procedure was successful at unlocking the biomolecular profile of FFPE colorectal adenocarcinoma tissues. Additionally, MALDI IMS analysis yielded similar mass ion peaks from both matrices (SA and HCCA) however HCCA seems to be better for the visualization of the tumor ROIs.
Furthermore, multivariate analysis of MALDI IMS spectral data revealed a series of mass ion peaks that allowed for the visualization of tumor ROIs and more importantly the ability to differentiate between tumor and normal ROIs in both FFPE and fresh frozen colon tissue biopsies. PCA analysis also yielded a specific pattern of mass ion peaks in different tumor regions that were distinguishable from the adjacent normal regions within a given specimen. Interestingly, all of the analyzed samples, independent of the storage conditions, were found to have a similar pattern of mass ion peaks overexpressed in tumor ROIs. The identification of the mass ion peaks responsible for the tissue heterogeneity within a colorectal adenocarcinoma specimen is of potential therapeutic interest and might play a key role to the understanding of the etiology of the disease.
Our findings are in accordance with some of the MALDI IMS data presented in other studies. In MALDI image-guided proteomic studies in fresh frozen section samples of primary colon tissues with and without lymph node metastasis, Walch and coworkers found a panel of ten significantly discriminating mass ion peaks [65]. Among which, the ion peaks at m/z 6277 and 6649 correlates with significantly discriminating ion peaks that we detected in FFPE tumor tissues at m/z 6280 and 6653 using SA matrix and at m/z 6277 and 6650 using HCCA matrix. In addition, the mass ion peak at m/z 6649 also correlates with our data in fresh frozen colon tissues where an ion peak at m/z 6653 was among the significantly discriminating peaks using SA matrix and an ion peak at m/z 6649 was among the significantly discriminating peaks using HCCA matrix.
It should be noted that mass differences between publications can be either explained by pre-analytical molecular changes, low-quality data acquisition, different biological matrix used for the analysis or closely related quasi molecular ions due to reactions during sample preparation, adduct ion formation or the loss of smaller functional groups.
The above results demonstrate that the described multivariate data analysis is able to reveal tumor heterogeneity in both FFPE and fresh frozen colorectal adenocarcinoma biopsies. However, MALDI IMS technique is nearly impossible to directly detect high molecular mass biomarkers, with molecular mass greater than 25 kDa, that are currently used in clinical cancer research. A number of reports have shown a correlation between the cysteine protease activities and tumor development in human colorectal cancer [66,67]. The deregulation of this proteolytic activity in tumor may be responsible for the formation of the low molecular mass proteins or peptide fragments detected. Therefore the mass ion peaks detected in this study might represent unknown proteins of low molecular weight or fragments of peptides or proteins with high molecular mass which are up-regulated in colorectal adenocarcinoma and may play a role in signaling pathways of this disease.
Conclusions
The development of protein biomarkers in colorectal cancer not only provides potentially useful clinical tools but it also represents a rich source of information through which researchers can gain a better understanding of the development, progression, and possible metastasis of this disease. Nowadays, tumor microenvironment profiling approaches are gaining increasing attention in cancer research and clinical cancer care mainly focuses on “targeted therapy”. The problem of tumor genetic heterogeneity is known to be a barrier to the development of effective targeted therapies. However, heterogeneity at the protein level in tumors has been less well studied [68]. Our findings highlight the degree of tumor heterogeneity inherent in colon cancer biopsies. The significant mass ion peaks detected through this work can differentiate between tumor and normal regions and their identification may provide insight into new important therapeutic targets. This study provides evidence in support of the clinical utility of MALDI IMS which is able to annotate tissues based solely on the detected MS profiles and thereby differentiate regions that are not distinct using established histopathological tools but which are characterized by different MS signatures. This ability to effectively define tumor regions by molecular profiling at high resolution will provide a greater understanding of molecular mechanisms of tumor heterogeneity and warrants further studies for the identification of the most significant peaks.
Acknowledgment
The authors wish to thank ELPEN Pharmaceutical Co. Inc., Pikermi Attica, Greece, for kind donation of donepezil and the company Chemic. S-Phenomenex for granting the SPE cartridges Strata X Drug-B Strong Cation
References
1. Gustafsson JOR, Oehler MK, Ruszkiewicz A, McColl SR, Hoffmann P. MALDI Imaging Mass Spectrometry (MALDI-IMS)-Application of Spatial Proteomics for Ovarian Cancer Classification and Diagnosis. Int J Mol Sci 12, 773-794 (2011). [CrossRef]
2. Seeley EH, Caprioli RM. MALDI imaging mass spectrometry of human tissue: method challenges and clinical perspectives. Trends Biotechnol 29, 136-143 (2011). [CrossRef]
3. Watrous JD, Alexandrov T, Dorrestein PC. The evolving field of imaging mass spectrometry and its impact on future biological research. J Mass Spectrom 46, 209-222 (2011). [CrossRef]
4. Aichler M, Walch A. MALDI Imaging mass spectrometry: current frontiers and perspectives in pathology research and practice. Lab Invest 95, 422-431 (2015). [CrossRef]
5. Schwamborn K, Caprioli RM. MALDI Imaging Mass Spectrometry – Painting Molecular Pictures. Mol Oncol 4, 529-538 (2010). [CrossRef]
6. Jiang L, Chughtai K, Purvine SO, Bhujwalla ZM, Raman V, Paša-Tolić L, Heeren RMA, Glunde K. MALDI-Mass Spectrometric Imaging Revealing Hypoxia-Driven Lipids and Proteins in a Breast Tumor Model. Anal Chem 87, 5947-5956 (2015). [CrossRef]
7. Crecelius AC, Schubert US, von Eggeling F. MALDI mass spectrometric imaging meets “omics”: recent advances in the fruitful marriage. Analyst 140, 5806-5820 (2015) [CrossRef]
8. Prentice BM, Chumbley CW, Caprioli RM. High-speed MALDI MS/MS imaging mass spectrometry using continuous raster sampling. J Mass Spectrom 50, 703-710 (2015) [CrossRef]
9. Khatib-Shahidi S, Andersson M, Herman JL, Gillespie TA, Caprioli RM. Direct molecular analysis of whole-body animal tissue sections by imaging MALDI mass spectrometry. Anal Chem 78, 6448-6456 (2006). [CrossRef]
10. Groseclose MR, Andersson M, Hardesty WM, Caprioli RM. Identification of proteins directly from tissue: in situ tryptic digestions coupled with imaging mass spectrometry. J Mass Spectrom 42, 254-262 (2007). [CrossRef]
11. McDonnell LA, Corthals GL, Willems SM, van Remoortere A, van Zeijl RJ, Deelder AM. Peptide and protein imaging mass spectrometry in cancer research. J Proteom 73, 1921-1944 (2010). [CrossRef]
12. Han EC, Lee YS, Liao WS, Liu YCh, Liao HY, Jeng LB. Direct tissue analysis by MALDI-TOF mass spectrometry in human hepatocellular carcinoma. Clin Chim Acta 412, 230-239 (2011). [CrossRef]
13. Fournaise E, Chaurand P. Increasing specificity in imaging mass spectrometry: high spatial fidelity transfer of proteins from tissue sections to functionalized surfaces. Anal Bioanal Chem 407, 2159-2166 (2015). [CrossRef]
14. Römpp A, Spengler B. Mass spectrometry imaging with high resolution in mass and space. Histochem Cell Biol 139, 759-783 (2013). [CrossRef]
15. Chaurand P, Sanders ME, Jensen RA, Caprioli RM. Proteomics in diagnostic pathology: profiling and imaging proteins directly in tissue sections. Am J Pathol 165, 1057-1068 (2004). [CrossRef]
16. Herb Brody Colorectal cancer. Nature 521 (7551), S1 (2015). [CrossRef]
17. Mekras A, Michalopoulos A, Papadopoulos VN, Mekras D, Kalles V, Tzeveleki I, Dabakis G, Netta S, Basdanis G. Changes in treatment of rectal cancer: increased use of low anterior resection. Techniq Coloproct 15, 51-54 (2011). [CrossRef]
18. Cancer Genome Atlas Network: Comprehensive molecular characterization of human colon and rectal cancer. Nature 487, 330-337 (2012). [CrossRef]
19. Manna SK, Tanaka N, Krausz KW, Haznadar M, Xue X, Matsubara T, Bowman ED, Fearon ER, Harris CC, Shah YM, Gonzalez FJ. Biomarkers of coordinate metabolic reprogramming in colorectal tumors in mice and humans. Gastroenterology 146(5), 1313-1324 (2014). [CrossRef]
20. Zhang B, Wang J, Wang X, Zhu J, Liu Q, Shi Z, Chambers MC, Zimmerman LJ, Shaddox KF, Kim S, Davies SR, Wang S, Wang P, Kinsinger CR, Rivers RC, Rodriguez H, Townsend RR, Ellis MJC, Carr SA, Tabb DL, Coffey RJ, Slebos RJC, Liebler DC. NCI CPTAC Proteogenomic characterization of human colon and rectal cancer. Nature 513, 382-387 (2014). [CrossRef]
21. Stahl PR, Schnellert J, Koop C, Simon R, Marx A, Izbicki JR, Sauter G, Quaas A. Determination of tumor heterogeneity in colorectal cancers using heterogeneity tissue microarrays. Pathol Oncol Res 21(4), 1183-1189 (2015). [CrossRef]
22. Beckler MD, Higginbotham JN, Franklin JL, Ham AJ, Halvey PJ, Imasuen IE, Whitwell C, Li M, Liebler DC, Coffey RJ. Proteomic analysis of exosomes from mutant KRAS colon cancer cells identifies intercellular transfer of mutant KRAS. Mol Cell Proteomics 12, 343-355 (2013). [CrossRef]
23. Phipps AI, Limburg PJ, Baron JA, Burnett-Hartman AN, Weisenberger DJ, Laird PW, Sinicrope FA, Rosty C, Buchanan DD, Potter JD, Newcomb PA. Association between molecular subtypes of colorectal cancer and patient survival. Gastroenterology 148, 77-87 (2015). [CrossRef]
24. Mulvey HE, Chang A, Adler J, Del Tatto M, Perez K, Quesenberry PJ, Chatterjee D. Extracellular vesicle-mediated phenotype switching in malignant and non-malignant colon cells. BMC Cancer 15, 1-14 (2015). [CrossRef]
25. French CL, Ye F, Revetta F, Zhang B, Coffey RJ, Washington MK, Deane NG, Beauchamp RD, Weaver AM. Linking patient outcome to high throughput protein expression data identifies novel regulators of colorectal adenocarcinoma aggressiveness. F1000Res 4(99), 1-24 (2015). [CrossRef]
26. Liu WT, Liu BY, Cai Q, Li JF, Chen XH, Zhu ZG. Proteomic identification of serum biomarkers for gastric cancer using multi-dimensional liquid chromatography and 2D differential gel electrophoresis. Clin Chim Acta 413, 1098–1106 (2012). [CrossRef]
27. Fan NJ, Gao CF, Wang XL, Zhao G, Liu QY, Zhang YY, Cheng BG. Serum peptidome patterns of colorectal cancer based on magnetic bead separation and MALDI-TOF mass spectrometry analysis. J Biomed Biotechnol 2012, 1-8 (2012). [CrossRef]
28. Zhu DX, Wang J, Ren L, Li Y, Xu B, Wei Y, Zhong YS, Yu XZ, Zhai SY, Xu JM, Qin XY. Serum proteomic profiling for the early diagnosis of colorectal cancer. J Cell Biochem 114 448-455 (2013). [CrossRef]
29. Ang CS, Phung J, Nice EC. The discovery and validation of colorectal cancer biomarkers. Biomed Chromatogr 25, 82-99 (2011). [CrossRef]
30. Pevsner PH, Melamed J, Remsen T, Kogos A, Francois F, Kessler P, Stern A, Anand S. Mass spectrometry MALDI imaging of colon cancer biomarkers: a new diagnostic paradigm. Biomark Med 3(1), 55-69 (2009). [CrossRef]
31. Shimma S, Sugiura Y, Hayasaka T, Hoshikawa Y, Tetsuo N, Setou M, MALDI-based imaging mass spectrometry revealed abnormal distribution of phospholipids in colon cancer liver metastasis. J Chromatogr B 855, 98–103 (2007). [CrossRef]
32. Mirnezami R, Spagou K, Vorkas PA, Lewis MR, Kinross J, Want E, Shion H, Goldin RD, Darzi A, Takats Z, Holmes E, Cloarec O, Nicholson JK. Chemical mapping of the colorectal cancer microenvironment via MALDI imaging mass spectrometry (MALDI-MSI) reveals novel cancer-associated field effects. Mol Oncol 8, 39-49 (2014). [CrossRef]
33. Bestard-Escalas J, Garate J, Maimó-Barceló A, Fernández R, Lopez DH, Lage S, Reigada R, Khorrami S, Ginard D, Reyes J, Amengual I, Fernández JA, Barceló-Coblijn G, Biochim Biophys Acta 1861, 1942-1950 (2016). [CrossRef]
34. Meding S, Nitsche U, Balluff B, Elsner M, Rauser S, Schöne C, Nipp M, Maak M, Feith M, Ebert MP, Friess H, Langer R, Höfler H, Zitzelsberger H, Rosenberg R, Walch A. Tumor classification of six common cancer types based on proteomic profiling by MALDI imaging. J Proteome Res 11, 1996-2003 (2012). [CrossRef]
35. Liao CCL, Ward N, Marsh S, Arulampalam T, Norton JD. Mass spectrometry protein expression profiles in colorectal cancer tissue associated with clinico-pathological features of disease. BMC Canc 10:410 (2010). [CrossRef]
36. Gemoll T, Strohkamp S, Schillo K, Thorns C, Habermann JK. MALDI-imaging reveals thymosin beta-4 as an independent prognostic marker for colorectal cancer. Oncotarget 6(41), 43869-43880 (2015).
37. Gustafsson OJR, Arentz G, Hoffmann P. Proteomic developments in the analysis of formalin-fixed tissue. Biochim Biophys Acta 1854, 559-580 (2015). [CrossRef]
38. Addis MF, Tanca A, Pagnozzi D, Crobu S, Fanciulli G, Cossu-Rocca P, Uzzau S. Generation of high-quality protein extracts from formalin-fixed, paraffin-embedded tissues. Proteomics 9, 3815-3823 (2009). [CrossRef]
39. Ronci M, Bonanno E, Colantoni A, Pieroni L, Di Ilio C, Spagnoli LG, Federici G, Urbani A. Protein unlocking procedures of formalin-fixed paraffin-embedded tissues: Application to MALDI-TOF Imaging MS investigations. Proteomics 8, 3702-3714 (2008). [CrossRef]
40. Marquardt C, Tolstik T, Bielecki C, Kaufmann R, Crecelius AC, Schubert US, Settmacher U, Stallmach A, Dirsch OZ. MALDI imaging-based classification of hepatocellular carcinoma and non-malignant lesions in fibrotic liver tissue. Gastroenteroly 53, 33-39 (2015). [CrossRef]
41. Belder N, Coşkun Ö, Erdoğan BD, Savaş B, Ensari A, Özdağ H. Optimization of gene expression microarray protocol for formalin-fixed paraffin-embedded tissues. Genomics Data 7, 303-306 (2016). [CrossRef]
42. Nirmalan NJ, Hughes C, Peng J, McKenna T, Langridge J, Cairns DA, Harnden P, Serby PJ, Banks RE. Initial development and validation of a novel extraction method for quantitative mining of the formalin-fixed paraffin-embedded tissue proteome for biomarker investigation. J Proteome Res 10, 896-906 (2011). [CrossRef]
43. Groseclose MR, Massion PP, Chaurand P, Caprioli RM. Highthroughput proteomic analysis of formalin-fixed paraffin-embedded tissue microarrays using MALDI imaging mass spectrometry. Proteomics 8, 3715-3724 (2008). [CrossRef]
44. Amico FD, Skarmoutsou E, Stivala F. State of the art in antigen retrieval immunohistochemistry. J Immun Meth 34, 1-18 (2009). [CrossRef]
45. Shi SR, Shi Y, Taylor CR. Antigen Retrieval Immunohistochemistry: Review and Future Prospects in Research and Diagnosis over Two Decades. J Histochem Cytochem 59, 13-32 (2011). [CrossRef]
46. Diehl HC, Beine B, Elm J, Trede D, Ahrens M, Eisenacher M, Marcus K, Meyer HE, Henkel C. The challenge of on-tissue digestion for MALDI MSI -A comparison of different protocols to improve imaging experiments. Anal Bioanal Chem 407, 2223-2243 (2015). [CrossRef]
47. Zimmerman TA, Monroe EB, Sweedler JV. Adapting the stretched sample method from tissue profiling to imaging. Proteomics 8, 3809-3815 (2008). [CrossRef]
48. Wang H, DeGnore JP, Kelly BD, True J, Garsha K, Bieniarz C. A technique for relative quantitation of cancer biomarkers in formalin-fixed, paraffin embedded (FFPE) tissue using stable-isotope label based mass spectrometry imaging (SILMSI). J Mass Spectrom 50, 1088-1095 (2015). [CrossRef]
49. Magdeldin S, Yamamoto T. Toward deciphering proteomes of formalin-fixed paraffin-embedded (FFPE) tissues. Proteomics 12, 1045-1058 (2012). [CrossRef]
50. Aerni HR, Cornett DS, Caprioli RM. High throughput profiling of formalin-fixed paraffin embedded tissue using parallel electrophoresis and matrix-assisted laser desorption ionization mass spectrometry. Anal Chem 81, 74-90 (2009). [CrossRef]
51. Djidja MC, Francese S, Loadman PM, Sutton CW, Scriven P, Claude E, Snel MF, Franck J, Salzet M, Clench MR. Detergent addition to tryptic digests and ion mobility separation prior to MS/MS improves peptide yield and protein identification for in situ proteomic investigation of frozen and formalin-fixed paraffin-embedded adenocarcinoma tissue sections. Proteomics 9, 2750-2763 (2009). [CrossRef]
52. Pietrowska M, Gawin M, Polańska J, Widłak P. Tissue fixed with formalin and processed without paraffin embedding is suitable for imaging of both peptides and lipids by MALDI-IMS. Proteomics 16 (11-12), 1670–1677 (2016). [CrossRef]
53. Taverna D, Pollins AC, Nanney LB, Sindona G, Caprioli RM. Histology-guided protein digestion/extraction from formalin-fixed and paraffin-embedded pressure ulcer biopsies, Exp Dermatol 25(2), 143-146 (2016). [CrossRef]
54. Ikeda K, Monden T, Kanoh T, Tsujie M, Izawa H, Haba A, Ohnishi T, Sekimoto M, Tomita N, Shiozaki H, Monden M. Extraction and analysis of diagnostically useful proteins from formalin-fixed, paraffin-embedded tissue sections. J Histochem Cytochem 46, 397-403 (1998). [CrossRef]
55. Becker KF, Schott C, Hipp S, Metzger V, Porschewski P, Beck R, Nahrig J, Becker I, Hofler H. Quantitative protein analysis from formalin-fixed tissues: implications for translational clinical research and nanoscale molecular diagnosis. J Pathol 211, 370-378 (2007). [CrossRef]
56. Rodriguez-Rigueiro T, Valladares-Ayerbes M, Haz-Conde M, Blanco M, Aparicio G, Fernandez-Puente P, Blanco FJ, Lorenzo MJ, Aparicio LA, Figueroa A. A novel procedure for protein extraction from formalin-fixed paraffin-embedded tissues Proteomics 11, 2555-2559 (2011). [CrossRef]
57. Wisniewski JR, Ostasiewicz P, Mann M. High recovery FASP applied to the proteomic analysis of micro dissected formalin fixed paraffin embedded cancer tissues retrieves known colon cancer markers. J Proteome Res 10 (2011) 3040–3049. [CrossRef]
58. Maes E, Valkenborg D, Mertens I, Broeckx V, Baggerman G, Sagaert X, Landuyt B, Prenen H, Schoofs L. Proteomic analysis of formalin-fixed paraffin embedded colorectal cancer tissue using tandem mass tag protein labelling. Mol Biosyst 9, 2686–2695 (2013). [CrossRef]
59. Bronsert P, Weisser J, Biniossek ML, Kuehs M, Mayer B, Drendel V, Timme S, Shahinian H, Kusters S, Wellner UF, Lassmann S, Werner M, Schilling O. Impact of routinely employed procedures for tissue processing on the proteomic analysis of formalin-fixed paraffin-embedded tissue. Proteomics Clin Appl 8(10), 796-804 (2014). [CrossRef]
60. Kakimoto Y, Tsuruyama T, Yamamoto T, Furuta M, Kotani H, Ozeki M, Yoshizawa A, Haga H, Tamaki K. Novel in situ pretreatment method for significantly enhancing the signal in MALDI-TOF MS of formalin-fixed paraffin-embedded tissue sections. PLoS One 7, e41607 (2012). [CrossRef]
61. Cho YT, Chiang YY, Shiea J, Hou MF. Combining MALDI-TOF and molecular imaging with principal component analysis for biomarker discovery and clinical diagnosis of cancer. Genom Med Biom Health Sci 4, 3-6 (2012). [CrossRef]
62. Alexandrov T. MALDI imaging mass spectrometry: statistical data analysis and current computational challenges. BMC Bioinformatics 13, 1-13 (2012).
63. Deininger SO, Becker M, Suckau D. Tutorial: Multivariate Statistical Treatment of Imaging Data for Clinical Biomarker Discovery. Methods Mol Biol 656, 385-403 (2010). [CrossRef]
64. Panderi I, Yakirevich E, Papagerakis S, Noble L, Lombardo K, Pantazatos D. Differentiating tumor heterogeneity in FFPE prostate adenocarcinoma tissues using PCA analysis of MALDI IMS spectral data. Rapid Commun Mass Spectrom. 31(2), 160-170 (2016). [CrossRef]
65. Meding S, Balluff B, Elsner M, Schone C, Rauser S, Nitsche U, Maak M, Schafer A, Hauck SM, Ueffing M, Langer R, Hofler H, Friess H, Rosenberg R, Walch A. Tissue-based proteomics reveals FXYD3, S100A11 and GSTM3 as novel markers for regional lymph node metastasis in colon cancer. J Pathol 228, 459-470 (2012). [CrossRef]
66. Rakashanda S, Rana F, Rafiq S, Masood A, Amin S. Role of proteases in cancer: A review. Biotechnol Mol Biol Rev 7(4), 90-101 (2012). [CrossRef]
67. Brenner H, Kloor M, Peter C. Colorectal cancer. The Lancet 383(9927) 1490-1502 (2014). [CrossRef]
68. Coghlin C, Murray GI. Biomarkers of colorectal cancer: Recent advances and future challenges. Proteomics Clin Appl 9, 64-71 (2015). [CrossRef]
All site content, except where otherwise noted, is licensed under a Creative Commons Attribution 4.0 License
