OPEN-ACCESS PEER-REVIEWED
RESEARCH ARTICLE
Kai Wang*, Mu Chen, Helen Weng, Yu Gao, Harry Zhao, Zhongping Lin
Frontage Laboratories Inc. Exton, PA 19341, USA.
Journal of Applied Bioanalysis. Vol.4. No.2. pages 51-61 (2018)
Published 15 April 2018. https://doi.org/10.17145/jab.18.008 | (ISSN 2405-710X)
*Correspondence:
Wang K . Frontage Laboratories Inc., 700 Pennsylvania Drive, Exton, PA 19341, USA. Phone: +1 4842763485.
Citation:
Wang K, Chen M, Weng H, Gao Y, Zhao H, Lin Z. Validation of A Robust and High-Throughput HPLC-MS/MS Method to Determine Amantadine Levels in Human Plasma. J Appl Bioanal 4(2), 51-61 (2018).
Editor: Dr. Jennifer Knaack. Mercer University, USA.
Open-access and Copyright:
©2018 Wang K et al. This article is an open access article distributed under the terms of the Creative Commons Attribution License (CC-BY) which permits any use, distribution, and reproduction in any medium, provided the original author(s) and source are credited.
Funding/Manuscript writing assistance:
The authors have no financial support or funding to report and they also declare that no writing assistance was utilized in the production of this article.
Competing interest:
The authors have declared that no competing interest exists.
Article history:
Received December 4, 2017, Revised February 23, 2018, Accepted February 26, 2018.
Abstract
Objectives
A simple, robust and high-throughput HPLC-MS/MS method was developed and validated for the determination of amantadine in human plasma.
Methods
The analyte and its stable isotope-labeled internal standard amantadine-d15 were extracted using protein precipitation method and separation was achieved on an Agilent Eclipse Plus C18 column (50 x 3.0 mm, 3.5 µm). A triple quadrupole mass spectrometer was used for detection. Automation was employed with a Tomtec Quadra 4 Liquid Handling System to improve the throughput.
Results
Lower limit of quantitation was validated to be 15 ng/mL with a reduced sample volume of 20 µL comparing with previously reported methods. Calibration curve was linear over a concentration range of 15-2000 ng/mL. In addition to linearity, other parameters including matrix selectivity, matrix effect, recovery, method accuracy and precision, sensitivity, and stabilities of amantadine under storage conditions were also fully validated following the guidance of United States Food and Drug Administration.
Conclusions
An HPLC-MS/MS method was developed and validated for the quantitation of amantadine in K2EDTA human plasma using a simple protein precipitation extraction method from a small sample volume of 20 µL.
Keywords
Amantadine, HPLC-MS/MS, human plasma, protein precipitation.
Introduction
Amantadine was a widely used antiviral drug since the 1960s [1-3]. The antiparkinsonian effect of amantadine has also been recognized and extensively studied [1, 4-6]. In 2017, U.S. Food and Drug Administration approved amantadine hydrochloride (trade name Gocovri) extended-release capsules to treat dyskinesia, a typical movement disorder for patients with Parkinson’s disease [7].
Various methods have been reported for the quantitation of amantadine in biological matrices. Rakestraw reported the using of capillary gas chromatography to determine amantadine concentration [8]. Farajzadeh utilized derivatization and micro-extraction technique to quantitate amantadine in human plasma and urine by gas chromatography coupled with flame ionization detection [9]. Several reports employed high-performance liquid chromatography (HPLC) for the quantitation of amantadine in human or animal matrices[10-15]. These methods suffer from low sensitivity due to the limitation of the detection technique, and low throughput resulting from the complex sample preparation procedures which often involved chemical derivatization. Over the past three decades, high-performance liquid chromatography–tandem mass spectrometry (HPLC-MS/MS) technique have evolved tremendously due to its advantages of selectivity, high sensitivity, fast method development duration, etc. Several methods employing HPLC-MS/MS platform for the quantitation of amantadine in human matrix were developed and reported. Torsten and coworkers developed and validated an amantadine LC-MS based method in human serum with an assay range of 50-1000 ng/mL [16]. Wang, Feng and Jie separately reported LC-MS/MS methods with improved sensitivity [17-19]. However, a large sample volume (up to 200 µL) and a complex extraction method (liquid-liquid extraction) were employed for these methods. Although Parkinsonism is known to affect mostly senior patients, Juvenile Parkinsonism has been recognized for many years [20-23]. For bioanalytical methods, a low sample volume is usually recommended because the method can be potentially adapted on the pediatric study. Here, we describe a simple, robust and high-throughput LC-MS/MS method with a validated assay range from 15 ng/mL to 2000 ng/mL using a reduced sample volume of 20 µL that is capable of supporting pediatric clinical studies if needed. When treating Parkinsonism, common amantadine hydrochloride daily dosing levels range from 100 to 400 mg depending on patient response to the drug. Dosing 200 mg amantadine resulted in a mean maximum plasma concentration of 510 ng/mL for young adults and 800 ng/mL for elderly adults in a single-dose pharmacokinetics study of amantadine hydrochloride [24]. In a different study, the amantadine plasma concentration ranged from 91 ng/mL to 4400 ng/mL with a mean daily dosing level of 135.1 mg [25]. Therefore, an assay range of 15 ng/mL to 2000 ng/mL was chosen to cover the expected plasma concentrations from different dosing levels. A 10-fold dilution was validated to extend the upper quantitation limit (ULOQ) up to 20000 ng/mL in case samples with amantadine concentration greater than ULOQ are obtained during clinical sample analysis.
Materials and methods
Chemicals and reagents
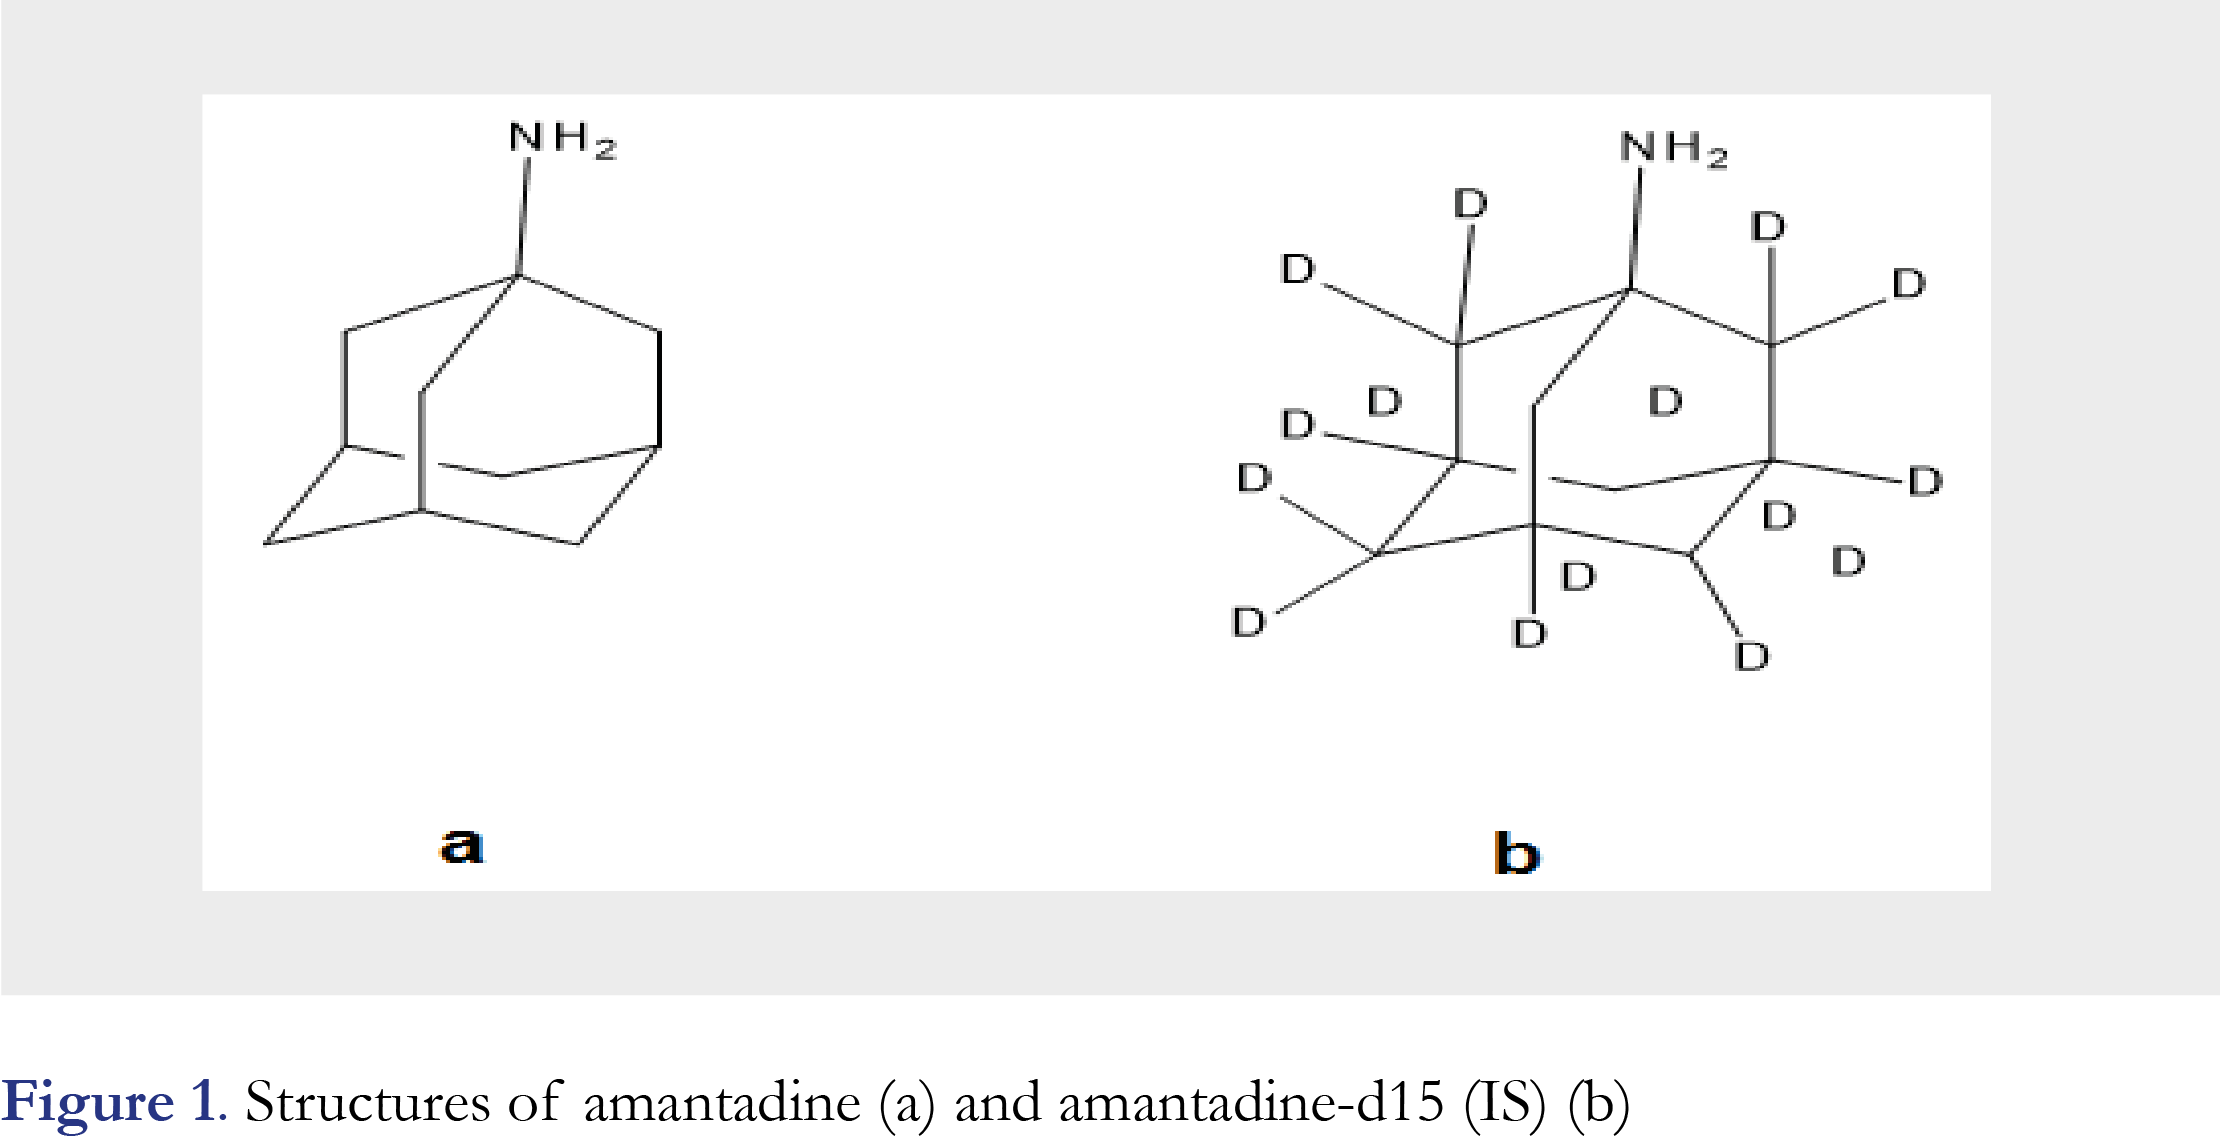
Both amantadine and the internal standard amantadine-d15 were purchased from Toronto Research Chemicals (North York, ON, Canada) in the form of hydrochloric salt (chemical purity: 98% for both amantadine and amantadine-d15). Please refer to Figure 1 for structures of both. HPLC grade organic solvents methanol (MeOH) and acetonitrile (ACN) were purchased from BDH Chemicals (Dawsonville, GA, USA). Dimethyl sulfoxide (DMSO) was purchased from Fisher Scientific (Fair Lawn, NJ, USA) and was also HPLC grade. GR grade ammonium formate and formic acid were purchased from Acros Organics (Morris Plains, NJ, USA). Biological matrices (blank normal and hemolyzed K2EDTA human plasma, and K2EDTA human whole blood) were purchased from BioreclamationIVT (Westbury, NY, USA). Purified water (18.2 MΩ·cm) was obtained from an ELGA Purelab® classic water purification system (Woodbridge, IL, USA).
Equipment
Mettler Toledo (Columbus, OH, USA) MX5 micro balance (capable of weighing 0.000001 gram) and Sartorius (Bradford, MA, USA) CP225D analytical balance (capable of weighing 0.00001 gram) were used for laboratory weighing applications. Beckman Coulter (Indianapolis, IN, USA) Allegra® X-14R benchtop centrifuge was employed to perform sample spins and separation. Tomtec Quadra 4 Liquid Handling system (Hamden, CT, USA) was used for sample transfer.
LC-MS/MS instruments and methods
Shimadzu (Kyoto, Japan) HPLC system (LC-20AD pumps/SIL-20AC HT autosampler) coupled with Sciex API 4000 triple quadrupole mass spectrometer was used for chromatographical separation and detection of amantadine and amantadine-d15. Analyst software (version 1.6.1 or higher, Applied Biosystems, Foster city, CA, USA) was used to support the LC-MS system and perform instrument control and raw data acquisition. Acquired raw data were exported to Watson LIMS system (version 7.3, Thermo Fisher Scientific, Inc., Philadelphia, PA) for regression and processing. Gradient separation was achieved on an Agilent Eclipse Plus C18 HPLC column (50 x 3.0 mm, 3.5 µm) using 5 mM ammonium formate in H2O as mobile phase A and ACN as mobile phase B. The gradient started at 15% of B, and B percentage was increased to 35% at 1.6 minute, during which amantadine and amantadine-d15 were eluted from column (retention time was about 1.2 minute for both analyte and IS). B fraction was elevated to 100% at 1.7 minute and the column was flushed with 100% B until 3.7 minute. At 3.8 minute, B was restored back to 15% and maintained at 15% to 5.3 minute, when the injection cycle finished. Electrospray ionization (ESI) was used to produce protonated amantadine and protonated amantadine-d15 in positive ion mode and both ions were selected using multiple reaction monitoring (MRM) detection mode with MS transitions of m/z 152.0 → 135.1 for amantadine and m/z 167.2 → 150.1 for amantadine-d15, respectively. Signal response (peak area ratio of analyte and IS) was acquired for data processing and quantitation. General MS setting and compound dependent MS settings were optimized by directly infusing amantadine into the MS system in order to achieve the highest sensitivity.
Calibration standards and quality control samples
The Standard stock and QC stock solutions of amantadine were prepared separately by dissolving two separately-weighted amantadine hydrochloride reference standard into diluent (DMSO:MeOH, 3:7, v/v) to obtain a final concentration of 0.500 mg/mL for amantadine free base. The standard spiking solutions were subsequently diluted from standard stock solution at 15.0, 30.0, 90.0, 250, 500, 1000, 1600, 2000 ng/mL from STD-1 to STD-8, respectively. Five concentration levels of amantadine QC samples in human plasma (LLOQ: 15.0 ng/mL, QC Low: 45.0 ng/mL, QC Mid: 150 ng/mL, QC High: 1500 ng/mL, QC AQL 10×: 15000 ng/mL) were prepared during method validation. The QC samples were stored at both -20 °C and -70 °C for validation and stability testings. The internal standard stock solution was prepared in diluent at a concentration of 1.00 mg/mL (amantadine-d15 free base). IS spiking solution was diluted from IS stock solution to a final concentration of 500 ng/mL.
Sample preparation
Calibration standards were prepared freshly in each run batch by spiking 20 µL of the standard spiking solution into 20 µL of human plasma. For double blank (without IS), blank (with IS), QC samples and study samples, 20 µL of plasma was mixed with 20 µL of diluent (DMSO:MeOH, 3:7, v/v)). 20 µL of IS spike (500 ng/mL of amantadine-d15 in diluent) was added into each of the samples above except for double blank (20 µL of diluent will be spiked in as substitute) and mixed well. Both amantadine and IS were extracted using 500 µL of MeOH with a vigorous vortexing for approximately 60 seconds. After the samples were centrifuged for about 5 minutes at 2500xg, 20 µL of the supernatant was diluted by adding 400 µL of reconstitution solution (0.1% formic acid in MeOH/H2O, 1:4, v/v) in a 96-well HPLC plate using Tomtec. The amantadine and IS were diluted 588-fold using the protein precipitation extraction method, thus leading to highly clean extracted samples.
Validation procedures
During validation, eight calibration standards were freshly prepared in each validation run batch as described in section calibration standards and quality control samples. Six replicates of QC samples at four levels of concentration (LLOQ: 15.0 ng/mL, QC Low: 45.0 ng/mL, QC Mid: 150 ng/mL, QC High: 1500 ng/mL) were prepared and analyzed in three different batches to evaluate intra- and inter- run accuracy and precision. The recovery of the sample preparation was evaluated by comparing the mean area ratio of the extracted QC samples with the mean area ratio of unextracted samples at three different concentration levels in three replicates at each concentration level. The internal standard was added post-extraction for all recovery samples. The matrix effect was to evaluate the suppression or enhancement of ionization of amantadine by the presence of matrix components in the biological samples. Six lots of K2EDTA human plasma were randomly selected and extracted in single replicate following the method. Each of the posted extracted blank samples from six lots were spiked with analyte and IS spike solution at two concentration levels (QC Low and QC High) before the reconstitution step. Three replicates of neat samples were prepared in the same manner as matrix samples except that purified water was used to substitute plasma. During the analysis, it may be necessary to dilute the samples if the analyte concentrations are above the upper limit of quantitation (ULOQ, 2000 ng/mL). In order to verify that the dilution of a high concentration sample would yield an analytical response that is within the dynamic range and acceptable tolerance limits of the assay, pooled human plasma was fortified with amantadine at a concentration 10 times above the QC High sample concentration (15000 ng/mL) of the method. Six replicate samples were prepared by diluting the samples 10-fold with blank pooled plasma and assayed against the calibration curve.
Results and discussion
HPLC-MS/MS method development
Prior to the screening of HPLC columns, the multiple reaction monitoring (MRM) transition parameters for amantadine and amantadine-d15 (IS) were manually optimized by infusing a 200 ng/mL amantadine and IS solution into the electrospray ionization source. The exact Q1 and product mass, as well as the source-dependent and compound-dependent parameters were manually optimized to achieve the optimum response. Ionspray voltage, source temperature, nebulizing gas and drying gas were set to be 5000 volts, 600 °C, 65 psi and 55 psi, respectively. Declustering potential, entrance potential, collision energy and collision cell exit potential were kept at 80.0 volts, 10.0 volts, 26.0 volts and 10.0 volts, respectively. With the optimized parameters in hand, different mobile phase combinations were compared and columns were screened.
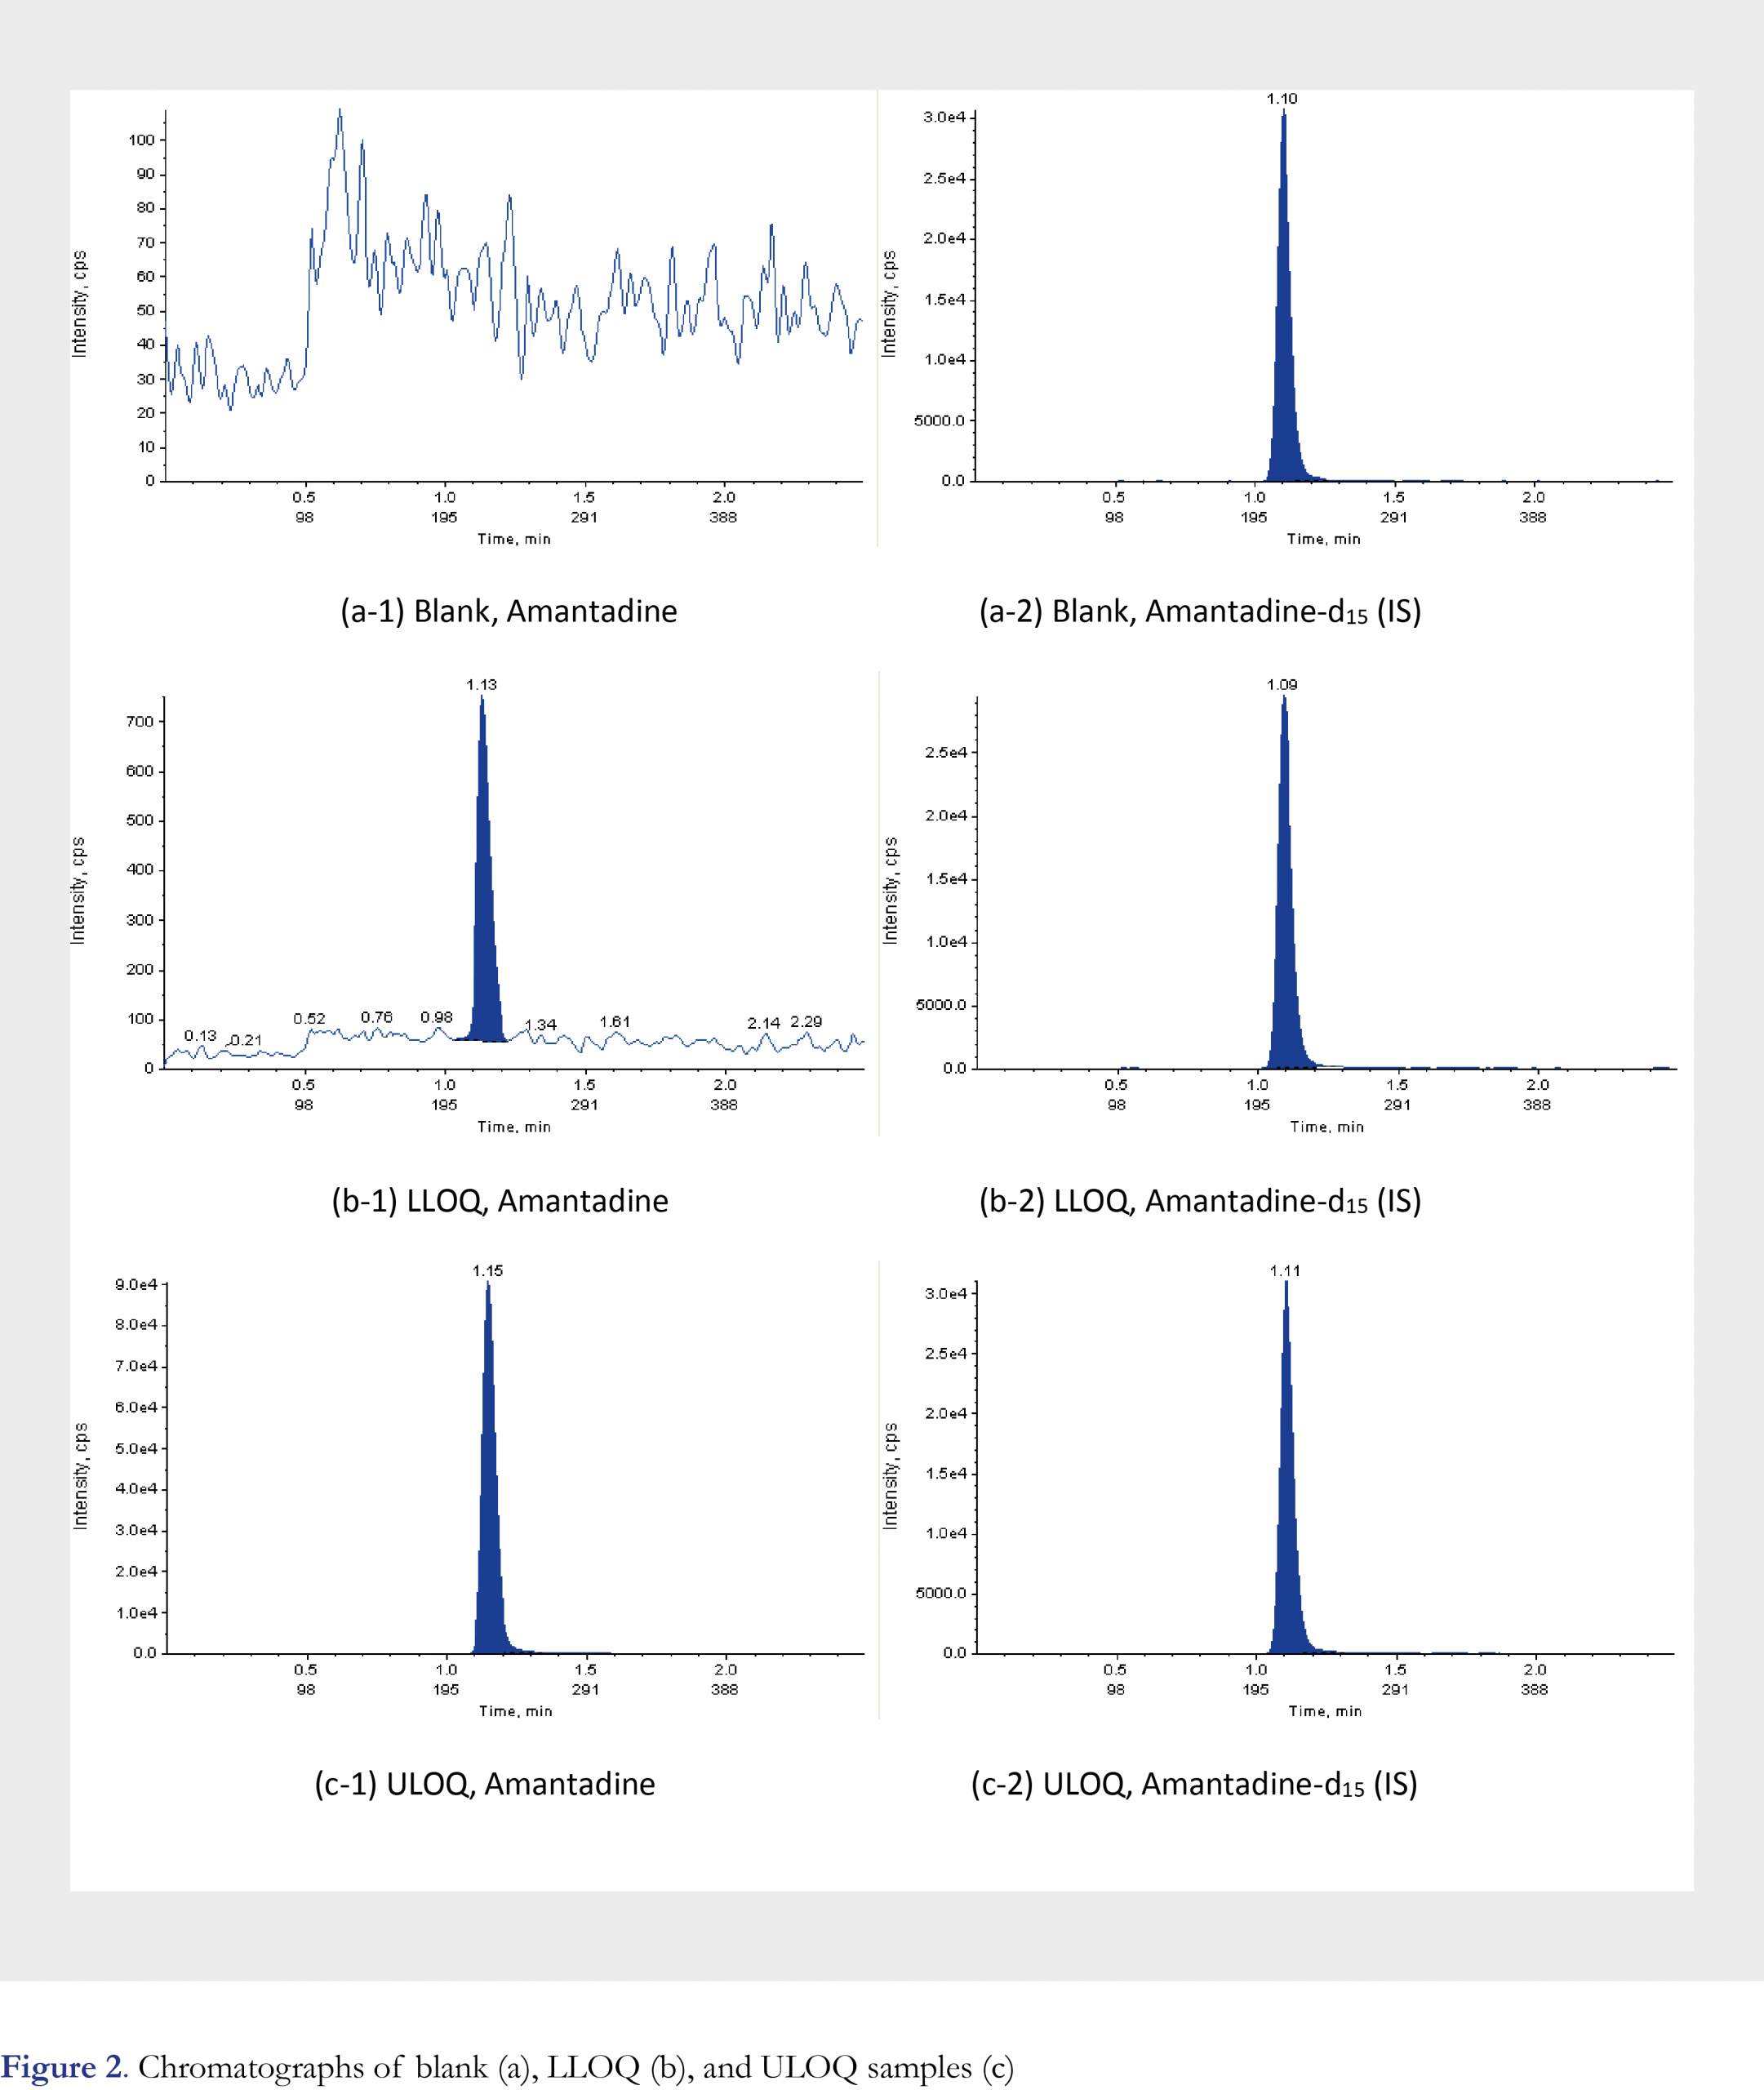
Literature searching results indicate that columns with various chemistry can be used for amantadine retention and separation in human matrix, such as Phenomenex Luna C8(2) (100 x 2.0 mm i.d., 3-microm)[16] and Thermo Hypersil-HyPURITYC18 reversed-phase column (150 mm x 2.1 mm i.d., 5 microm) [17]. A silica based column was also used for amantadine separation in poultry tissues and egg [26]. During method development, a total of five different columns were evaluated: Agilent Eclipse Plus, C18, 50 x 3.0 mm, 3.5 µm; Phenomenex Max-RP, 50 × 2.0 mm, 4 µm; Waters XBridge, C18, 50 x 2.1 mm, 3.5 µm; Waters Atlantis T3, 50 x 2.1 mm, 3 µm; Agilent Zorbax Bonus-RP 50 x 2.1 mm, 3.5 µm. Screening result indicated that under ambient temperature, Agilent Eclipse Plus C18 column gave the best sensitivity while maintaining good peak shape and retention in combination with the 5mM ammonium formate in H2O as mobile phase A and ACN as mobile phase B (Please refer to Figure 2 for selected chromatograms). Autosampler was also kept at ambient temperature. In order to improve the throughput of the method, automation was employed for sample preparation by using Tomtec Quadra 4 Liquid Handling System for supernatant transfer and reconstitution. By introducing the Tomtec system, the sample preparation time is shortened significantly when large quantity of study samples is processed, and helps reduce human error and improve efficiency.
Figures and Tables
[Click to enlarge]
Method validation results
Method validation was performed according to the FDA 2001 guidance [27], Viswanathan et. al. recommendations on best practice for bioanalytical validation [28], and applying relevant aspects of good laboratory practices (GLP) as a quality standard. The following validation parameters were evaluated: method selectivity, matrix effect, sensitivity, linearity (range), accuracy of the calibration standards, accuracy and precision of the quality control (QC) samples (intra-run and inter-run), recovery of the sample preparation, dilution integrity, re-injection reproducibility, processed sample stability, QC freeze/thaw stability, QC benchtop stability, whole blood stability, hemolysis effect, carryover evaluation and maximum batch size evaluation. The lowest limit of quantitation was validated to be 15 ng/mL for the current method.
Linearity of calibration curves
The calibration curve was linear over the targeted range of 15-2000 ng/mL for amantadine using a weighing factor of the reciprocal of the concentration squared (1/x2). During validation, the correlation coefficients (R2) were between 0.9972 to 0.9993, indicating very good linearity. Back-calculated concentrations for all standards were all within ±15% (±20% for LLOQ), and the results are presented in Table 1.
Precision and accuracy
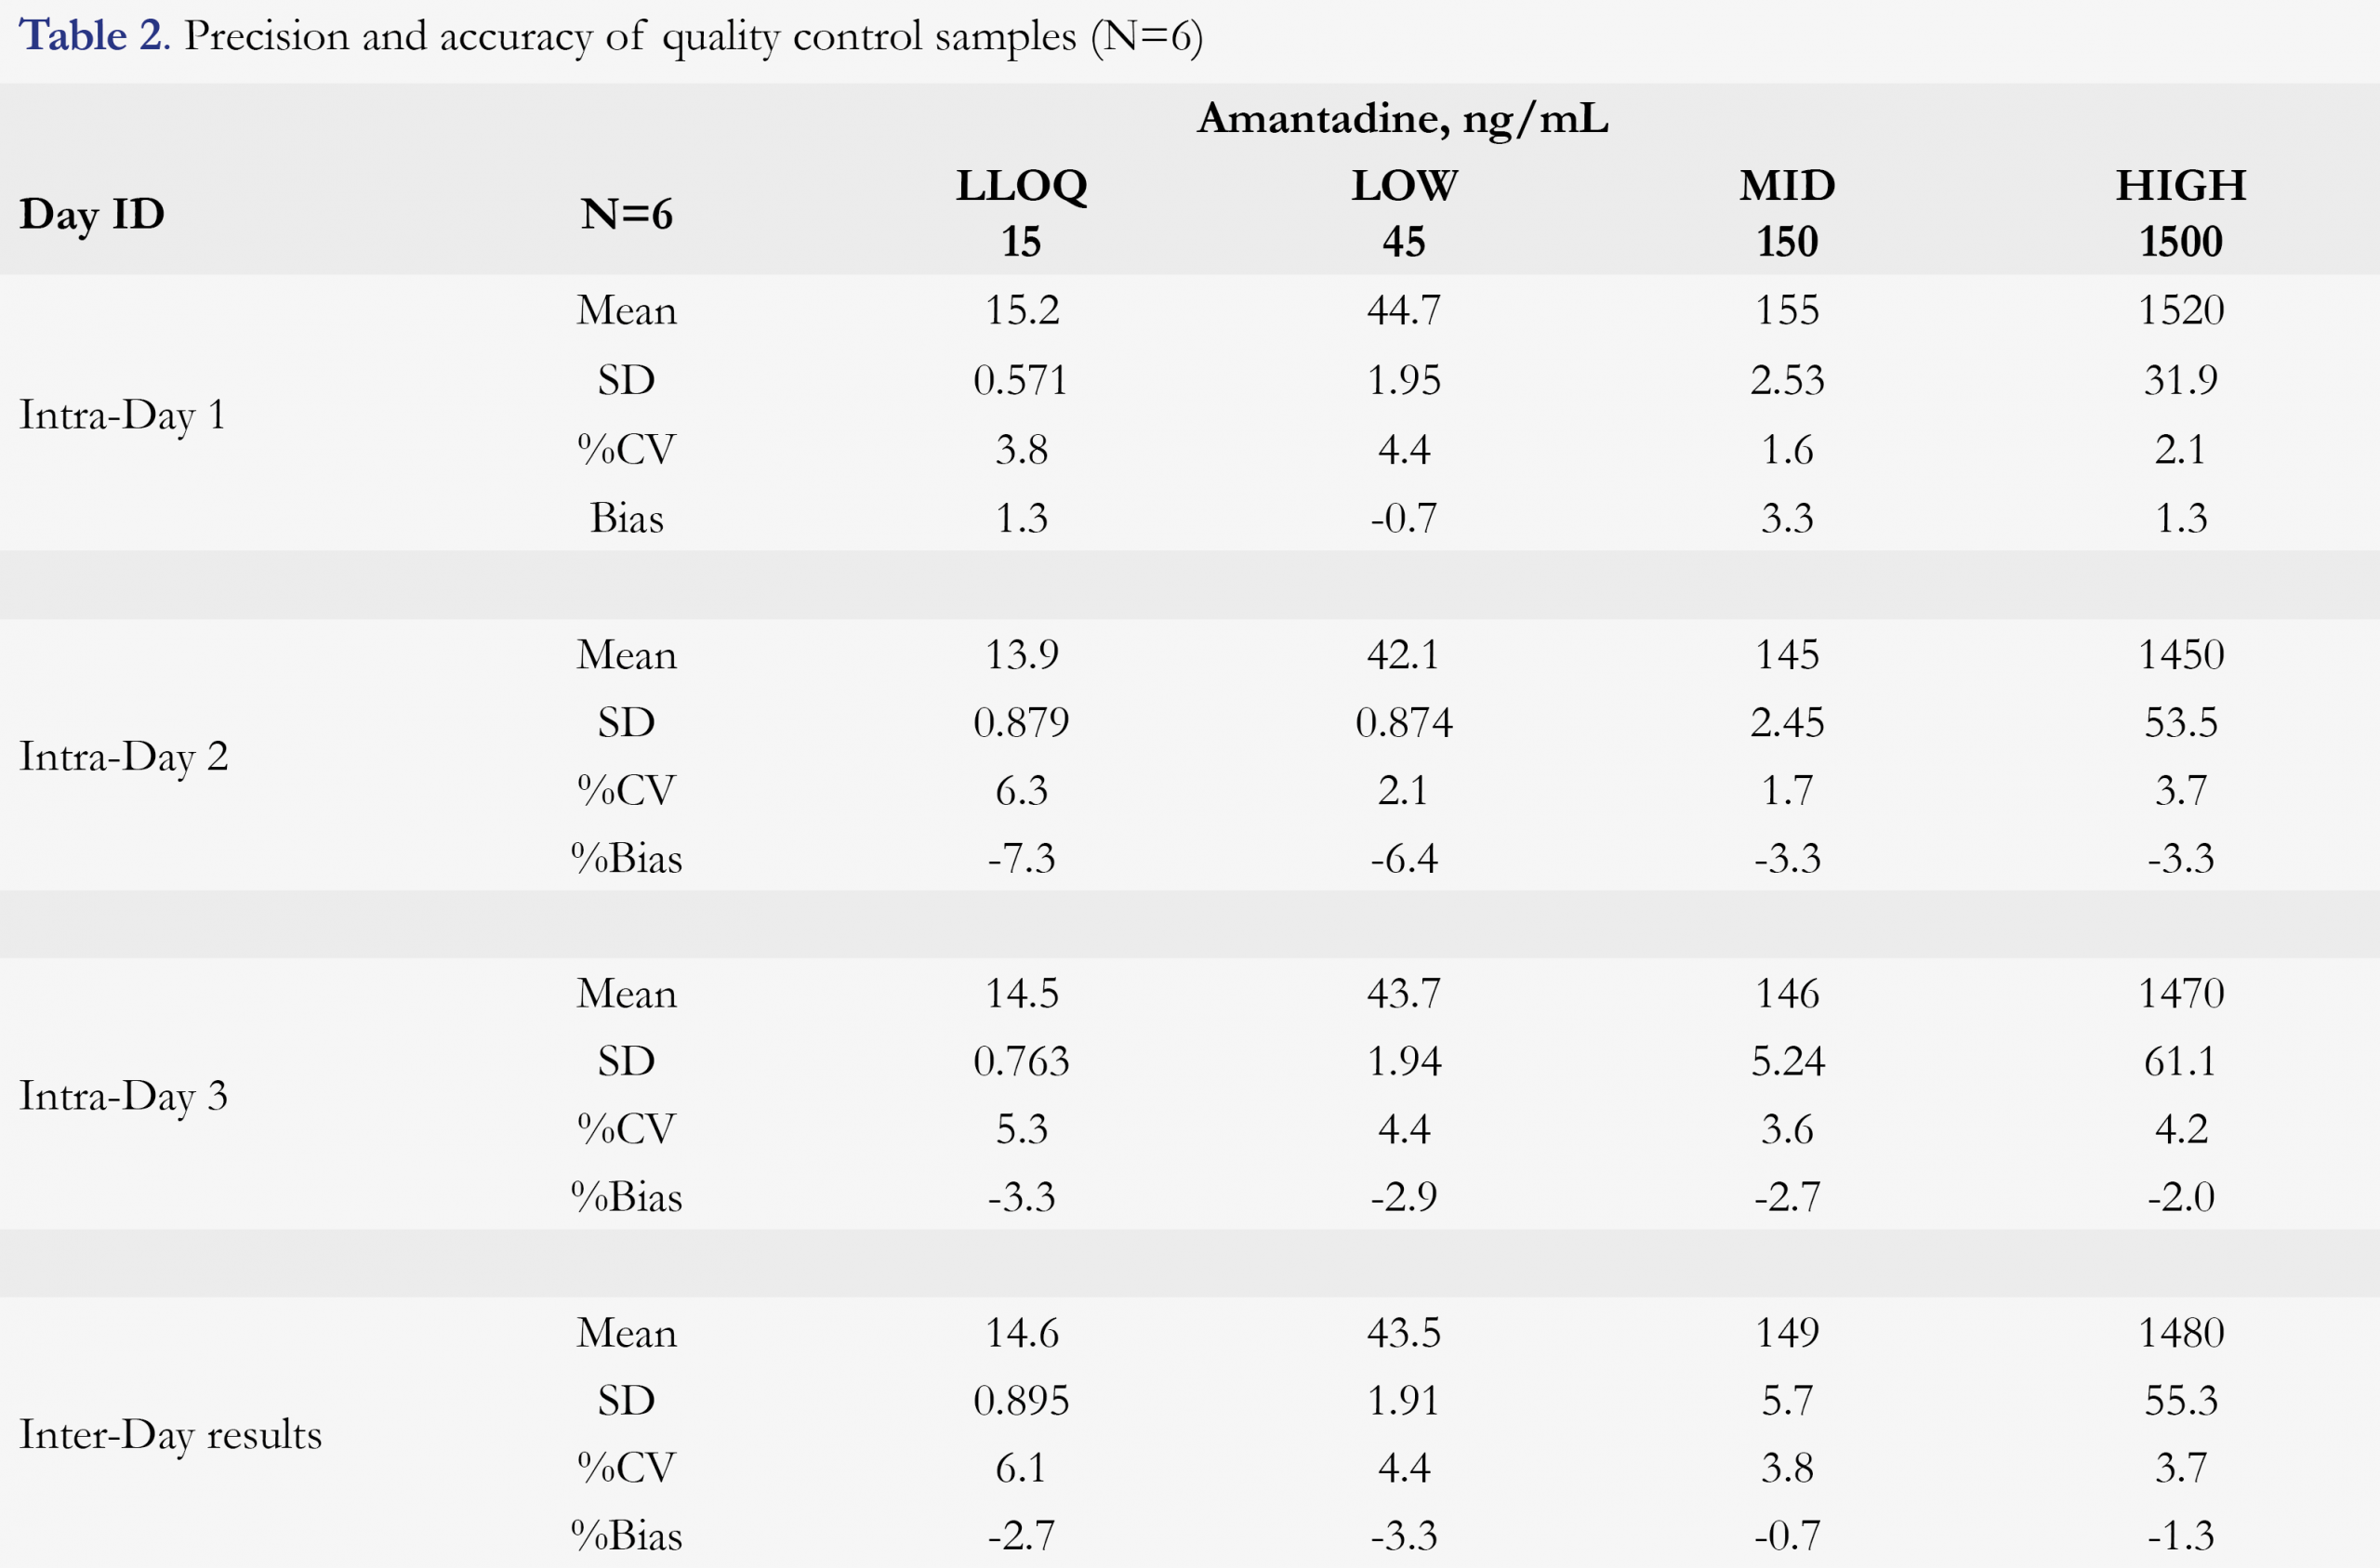
The overall accuracy (presented as %bias) was between -7.3% to 3.3% for intra-run accuracy and -3.3% to 0.7% for inter-run accuracy; and precision (presented as %CV) was within 6.6% for intra-run precision and 6.3% for inter-run precision. The results are presented in Table 2, indicating high robustness of the method.
Dilution integrity
The measured concentration is within 8.7% of the nominal concentration value and has a %CV of 2.3%, thus, a 10-fold dilution was validated and the upper limit of quantitation was increased to 20000 ng/mL.
Recovery
The recovery was measured to be 101.0%, 102.6% and 97.0% at QC Low, QC Mid and QC High concentration, respectively, thus yielding an average recovery of 100.2%. The results indicate that the recovery was consistent through the assay range and amantadine was fully extracted during sample extraction.
Matrix effect and matrix selectivity
The internal standard-normalized matrix effect across six different lots of blank plasma were very consistent (%CV was within 2.9%). Moreover, comparing with neat samples, both IS-normalized matrix effect (presented as area ratio) and absolute matrix effect (presented as area) from matrix samples were very consistent without any signal enhancement or suppression, indicating high-robustness of the method. For matrix selectivity, six lots of blank plasma were screened and no baseline interference (larger than 20% of the LLOQ for analyte and 5% for IS, respectively) was detected at the retention time of the analyte and IS for all lots.
Stability of the analyte
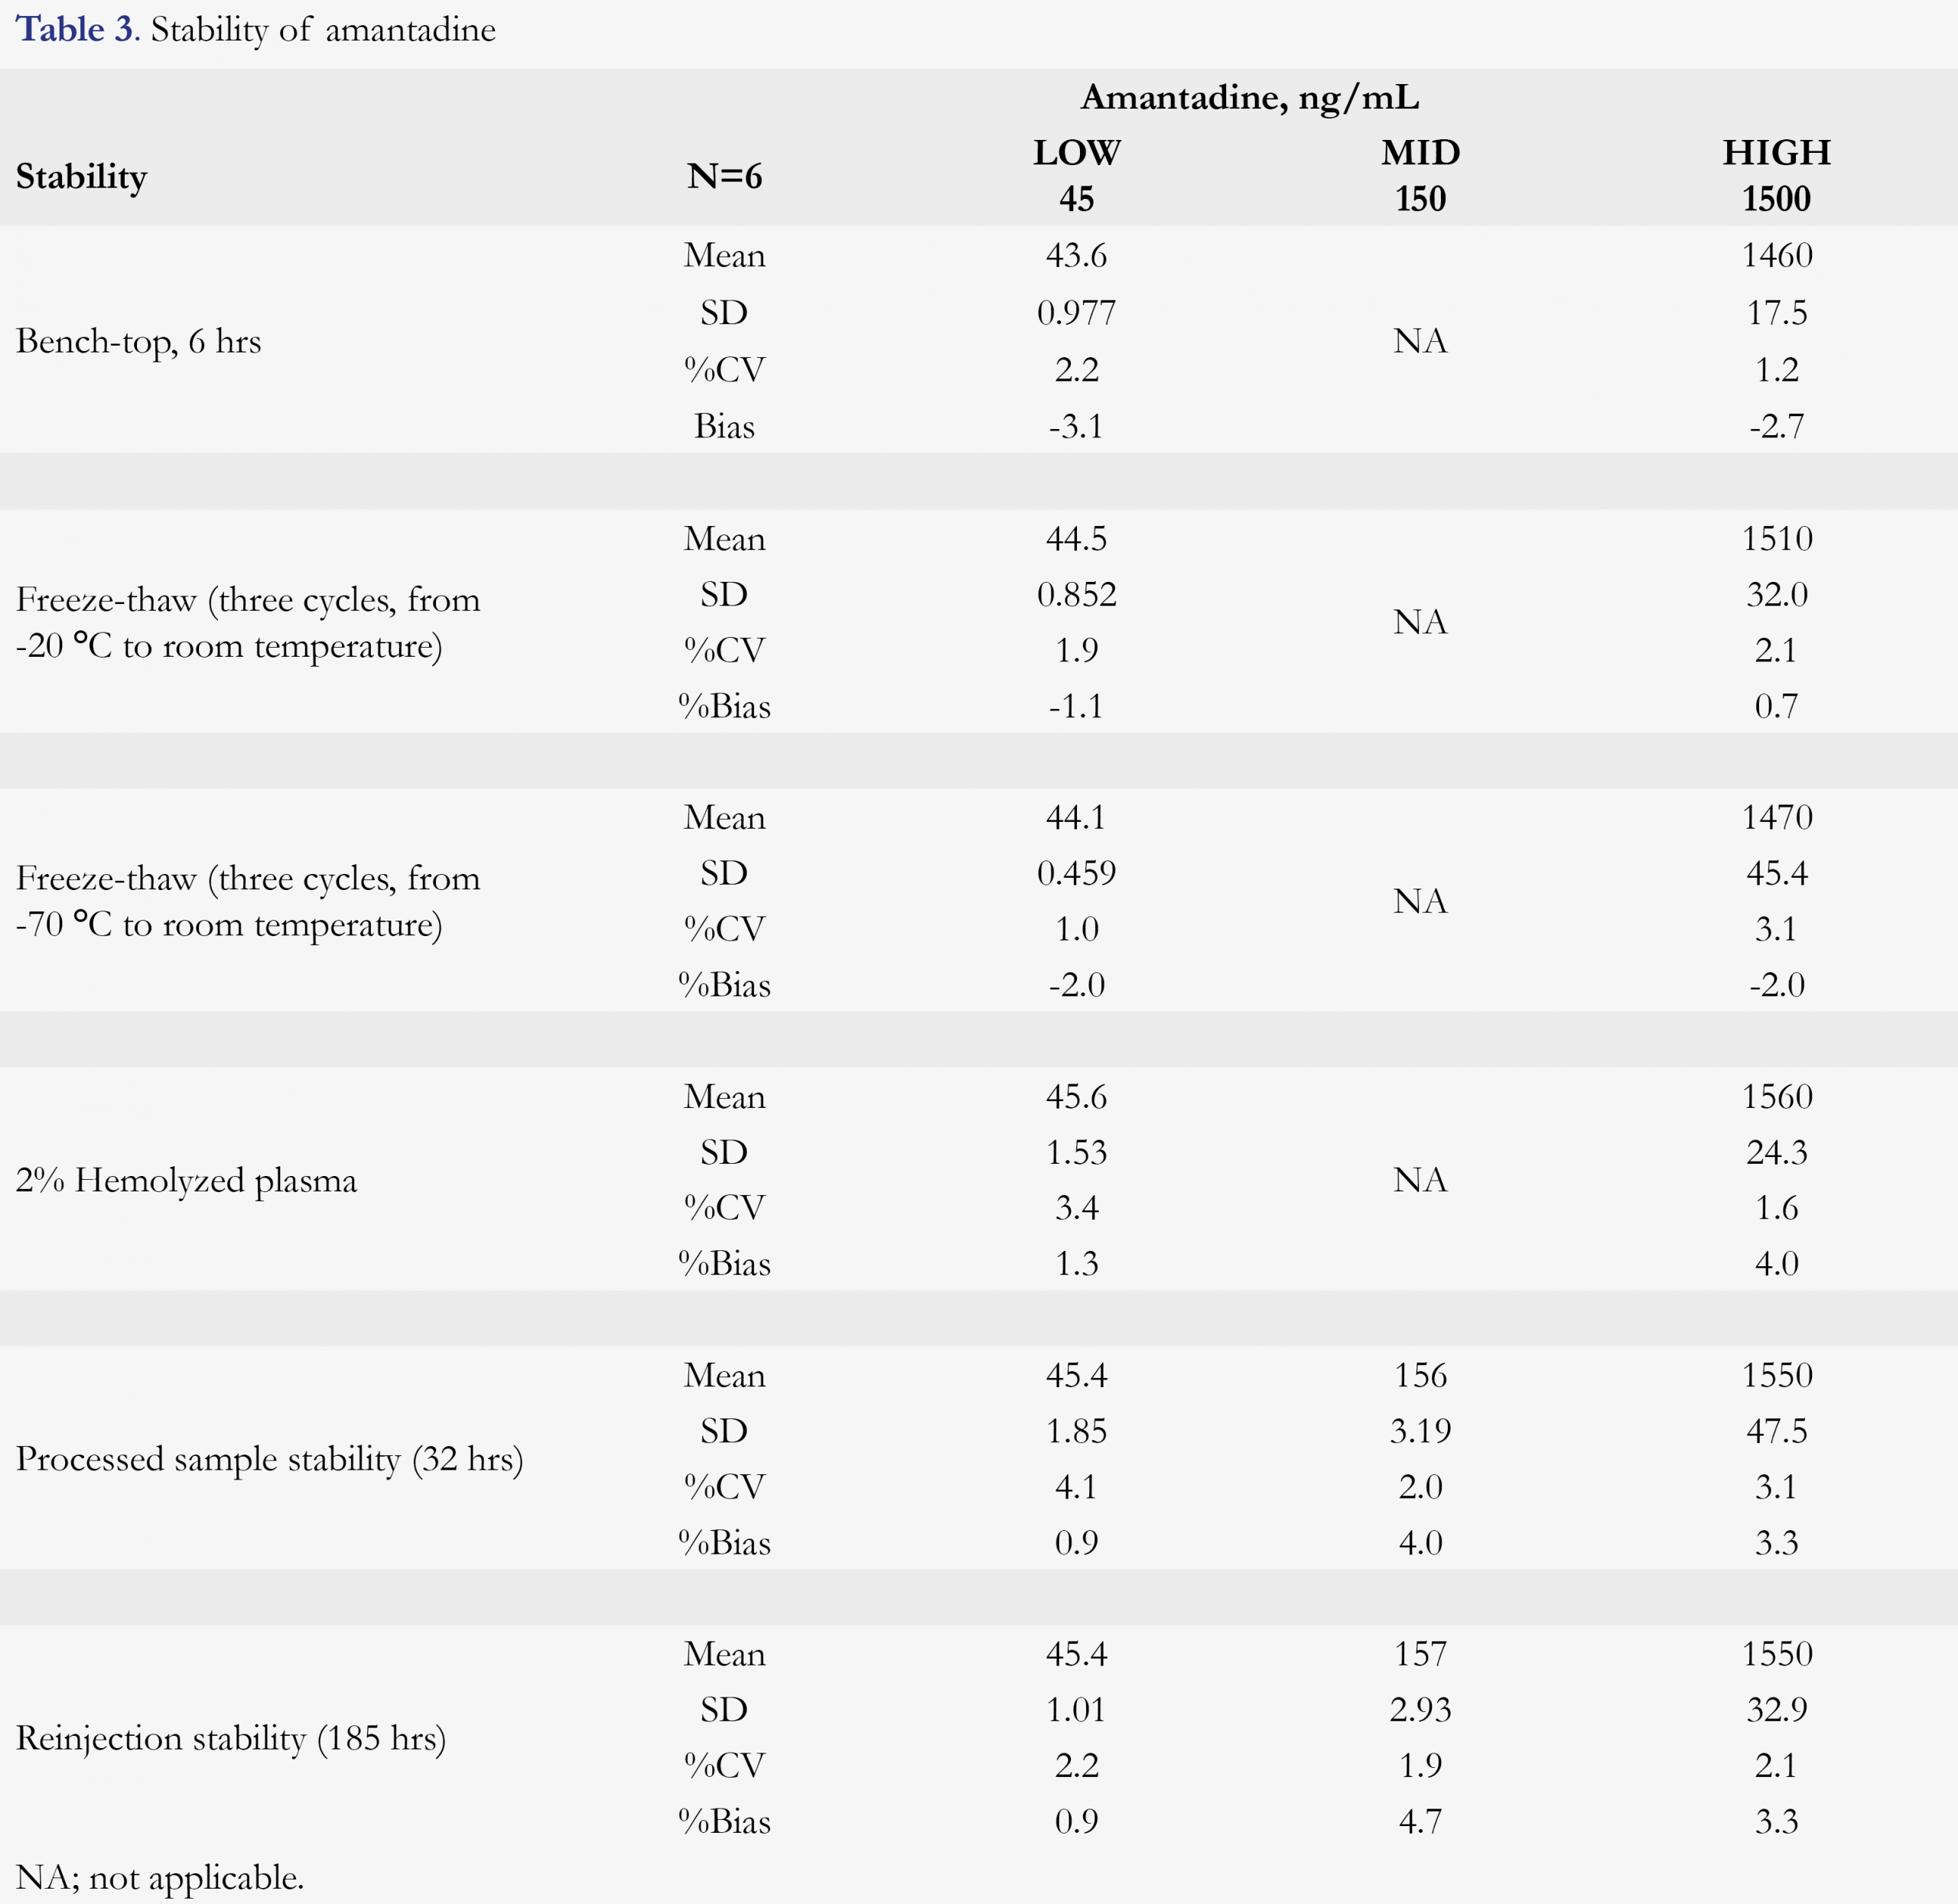
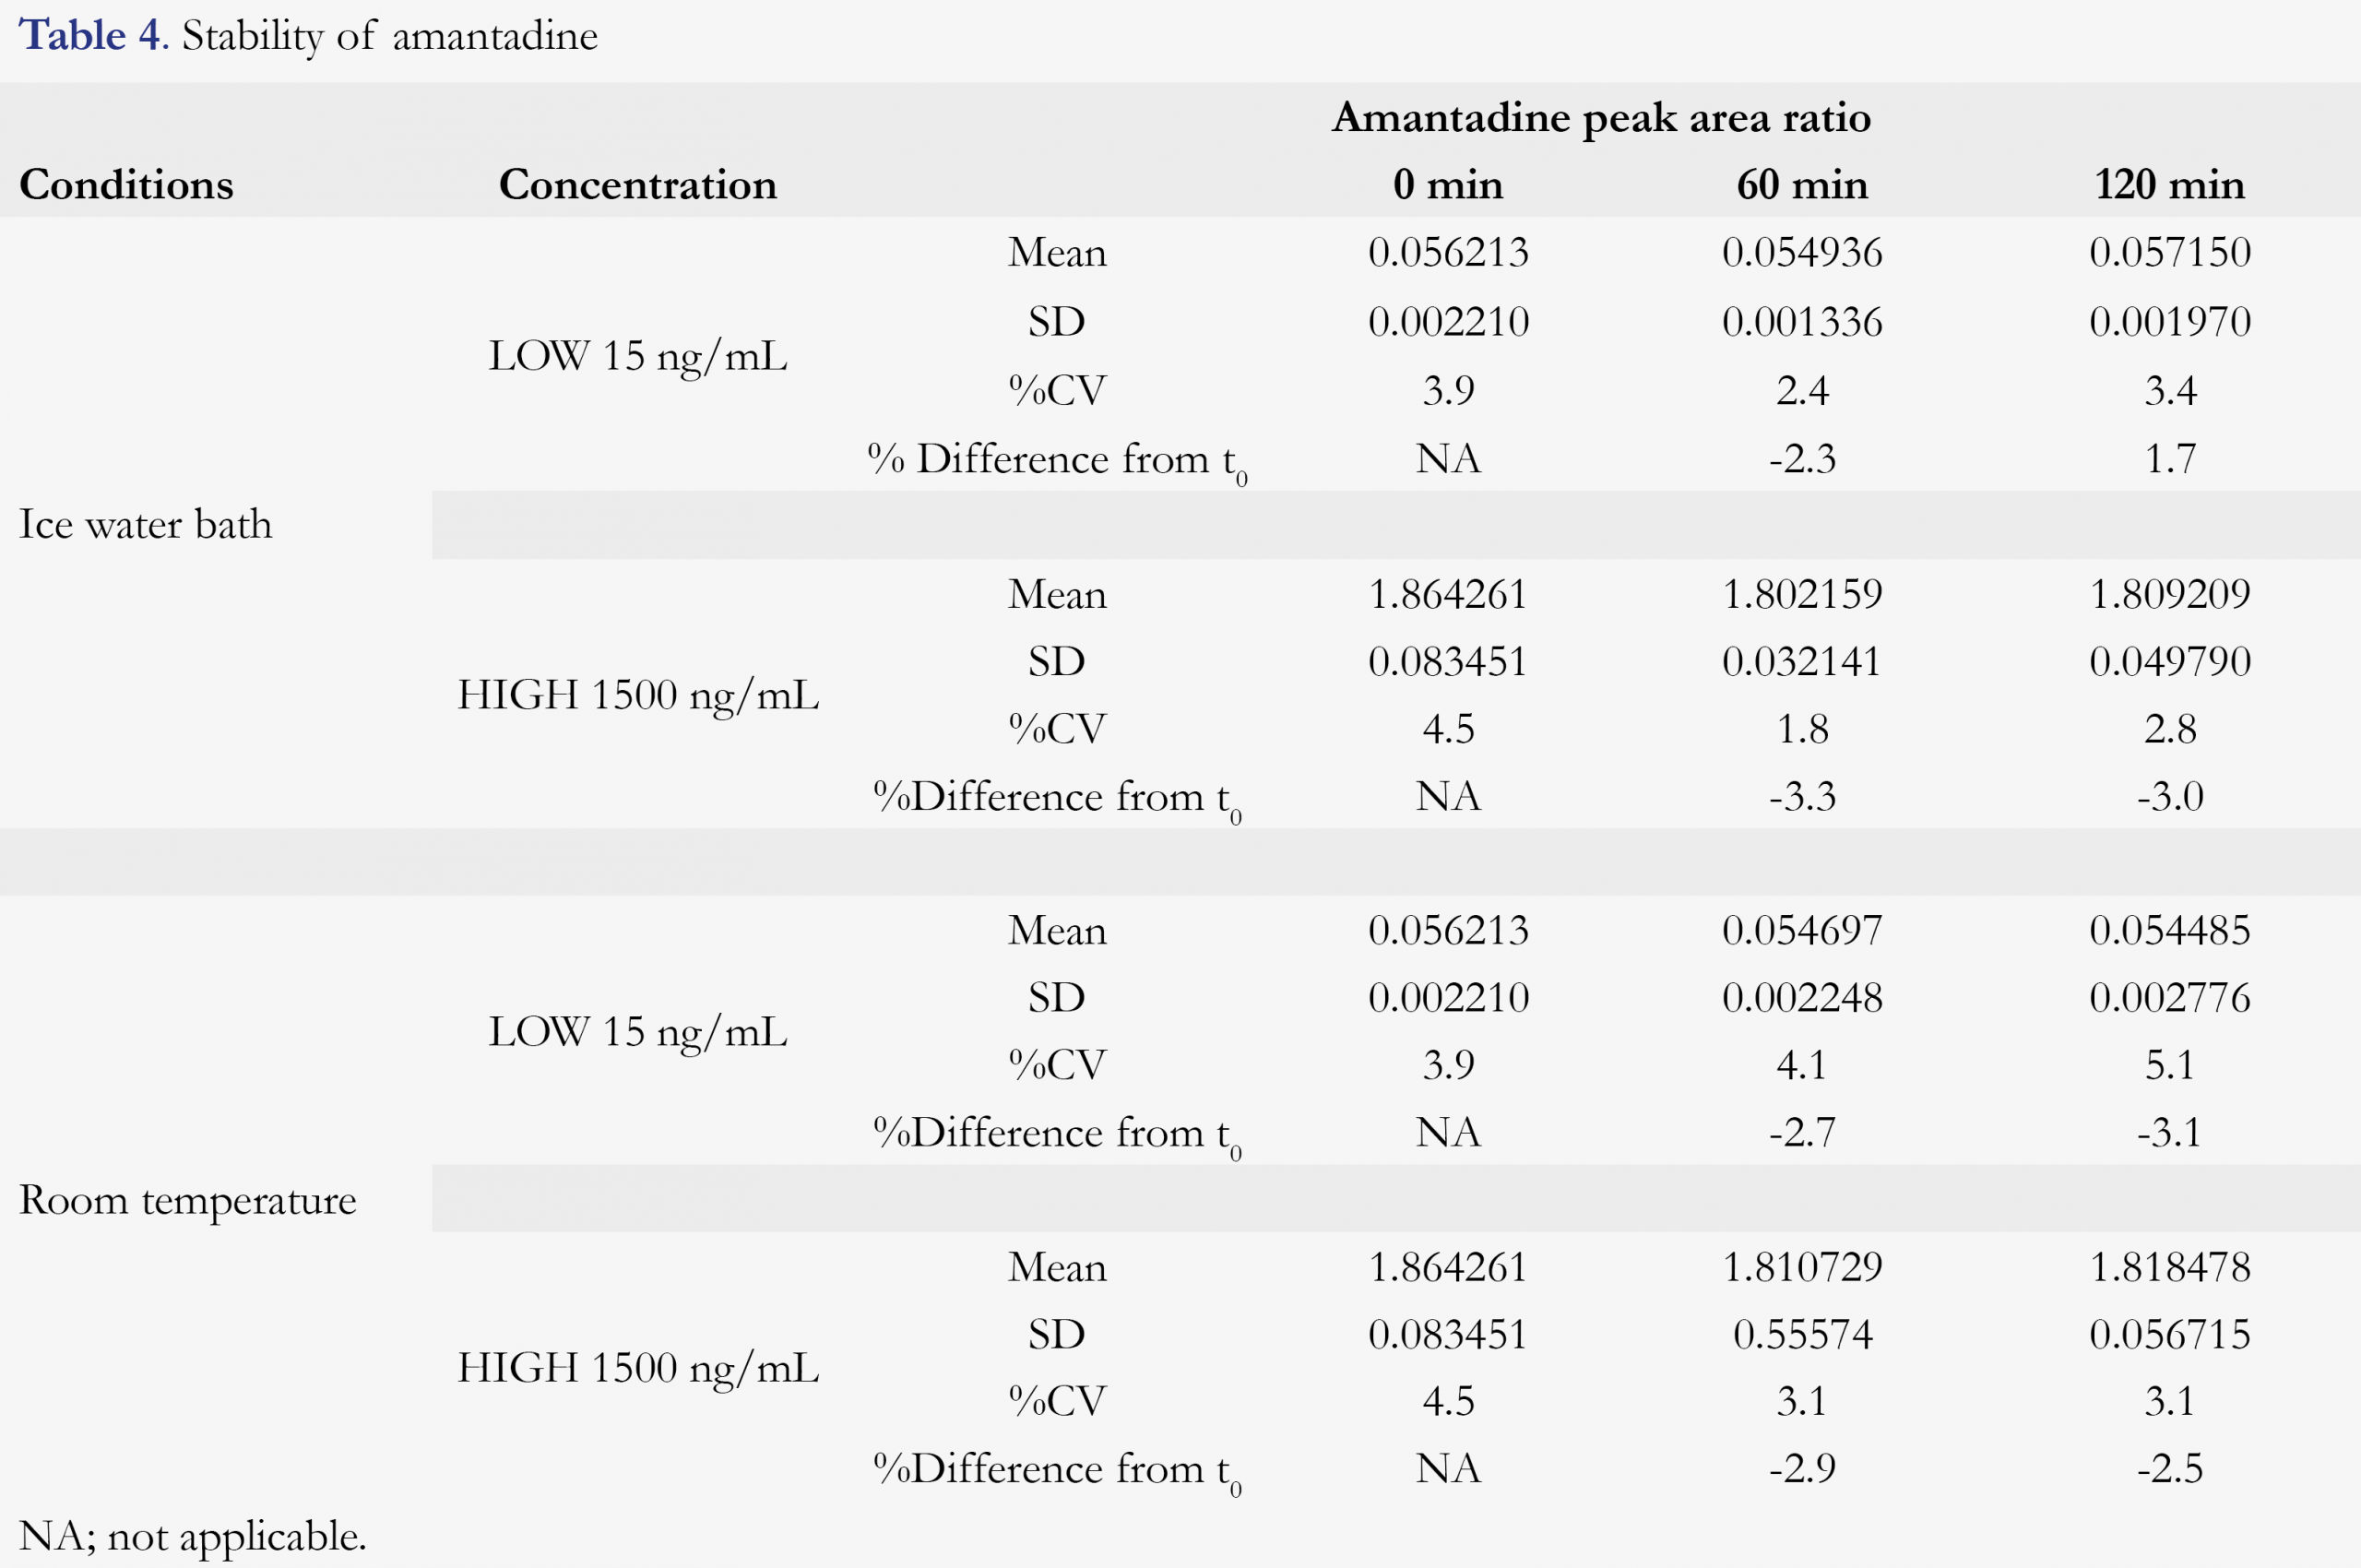
Various stability tests were conducted to mimic the possible sample handing conditions between sample collection and bioanalysis. Amantadine is found to be stable for at least 6 hours in human K2EDTA plasma at ambient temperature. After three freeze/thaw cycles (from a nominal of -20 or -70 °C freezer to room temperature), no stability issue was observed for amantadine. Hemolysis effect (amantadine stability in 2% hemolyzed plasma) and whole blood stability (at room temperature and ice-water bath) were also evaluated. 2% Hemolyzed plasma did not affect the quantitation of amantadine, nor any stability issue was observed for amantadine in human blood for up to 2 hours, at either room temperature or ice-water bath (4 °C). After the samples were being processed, it was good for reinjection for at least 185 hours and the processed samples were stable for at least 32 hours against a freshly prepared standard calibration curve. The amantadine plasma and blood stabilities are summarized in Table 3 and Table 4, respectively.
Interference of analyte to IS
The interference of the analyte amantadine on the IS amantadine-d15 was evaluated by preparing three replicates of the upper limit of quantitation (ULOQ, 1500 ng/mL for amantadine) and processing and analyzing the samples without the addition of the IS. No interference peak was observed in any of the three replicates samples for IS.
Carryover evaluation
To evaluate carryover, a double blank was placed after STD-8 sample in each validation run batch. All of the carryover samples had analyte peak areas that were less than 20% the peak area of the LLOQ when using 5 mM ammonium formate in ACN/MeOH, 1:1, v/v) as needle washing solvent.
Batch-Size evaluation
Largest batch in validation includes 133 samples and passed acceptance criteria very well. It indicated that the method was good for production with a batch size of at least 133 samples.
Conclusions
A simple, high-throughput and robust HPLC-MS/MS method was developed and validated for quantitation of amantadine in K2EDTA human plasma. Protein precipitation was used to extract amantadine and its internal standard amantadine-d15. Comparing with previously reported amantadine LC-MS methods, we significantly improved the throughput while maintaining high sensitivity and method robustness using a reduced sample volume of 20 µL. Considering amantadine and IS were diluted 588-fold using the current extraction method, if higher sensitivity is needed, it can be easily achieved by reducing the sample dilution fold. Validation results indicate the robustness of the method and it can be readily applied to clinical studies in the future.
References
1. Staniová J, Miškovský P, Šutiak V. Amantadine: An antiviral and antiparkinsonian agent. Vet Med 46(9–10), 244–256 (2001).
2. Steinmann E, Whitfield T, Kallis S, et al. Antiviral effects of amantadine and iminosugar derivatives against hepatitis C virus. Hepatology 46(2), 330–338 (2007). [CrossRef]
3. Finkel B, Goodman C, Melamed Y, Kurs R, Bleich A. Effect of antiviral amantadine treatment on elderly chronic schizophrenia patients. Isr Med Assoc J 12(9), 536–538 (2010).
4. Crosby NJ, Deane KHO, Clarke CE. Amantadine for dyskinesia in Parkinson’s disease. The Cochrane database of systematic reviews 2003(2), CD003467 (2003). https://www.cochranelibrary.com/wol1/doi/10.1002/14651858.CD003467/full?cookiesEnabled
5. Wolf E, Seppi K, Katzenschlager R, et al. Long-term antidyskinetic efficacy of amantadine in Parkinson’s disease. Mov Disord 25(10), 1357–1363 (2010). [CrossRef]
6. Sawada H, Oeda T, Kuno S, et al. Amantadine for dyskinesias in parkinson’s disease: A randomized controlled trial. PLoS One 5(12), e15298 (2010). [CrossRef]
7. Bastings E. Approval Letter NDA 208944 – FDA. https://www.accessdata.fda.gov/drugsatfda_docs/appletter/2017/208944Orig1s000ltr.pdf
8. Rakestraw D. Determination of amantadine in human plasma by capillary gas chromatography using electron-capture detection following derivatization with pentafluorobenzoyl chloride. J Pharm and Biomed Anal 11(8), 699–703 (1993). [CrossRef]
9. Farajzadeh MA, Nouri N, Alizadeh Nabil AA. Determination of amantadine in biological fluids using simultaneous derivatization and dispersive liquid-liquid microextraction followed by gas chromatography-flame ionization detection. J Chromatogr B Analyt Technol Biomed Life Sci 940, 142–149 (2013). [CrossRef]
10. Van Der Horst FAL, Teeuwsen J, Holthuis JJM, Brinkman UAT. High-performance liquid chromatographic determination of amantadine in urine after micelle-mediated pre-column derivatization with 1-fluoro-2,4-dinitrobenzene. J Pharm and Biomed Anal 8(8–12), 799–804 (1990). [CrossRef]
11. Higashi Y, Uemori I, Fujii Y. Simultaneous determination of amantadine and rimantadine by HPLC in rat plasma with pre-column derivatization and fluorescence detection for pharmacokinetics studies. Biomed Chromatogr 19(9), 655–662 (2005). [CrossRef]
12. Higashi Y, Nakamura S, Matsumura H, Fujii Y. Simultaneous liquid chromatographic assay of amantadine and its four related compounds in phosphate-buffered saline using 4-fluoro-7-nitro-2,1,3-benzoxadiazole as a fluorescent derivatization reagent. Biomed Chromatogr 20(5), 423–428 (2006). [CrossRef]
13. Shuangjin C, Fang F, Han L, Ming M. New method for high-performance liquid chromatographic determination of amantadine and its analogues in rat plasma. J Pharm and Biomed Anal 44(5), 1100–1105 (2007). [CrossRef]
14. Iwata T, Fujino H, Sonoda J, Yamaguchi M. Determination of amantadine in human plasma by high-performance liquid chromatography with fluorescence detection. Anal Sci 13(SUPPL.), 467–470 (1997). [CrossRef]
15. Higashi Y, Fujii Y. Liquid chromatographic determination of 1-adamantanamine and 2-adamantanamine in human plasma after pre-column derivatization with o-phthalaldehyde and 1-thio-ß-D-glucose. J Chromatogr B Analyt Technol Biomed Life Sci 799(2), 349–354 (2004). [CrossRef]
16. Arndt T, Guessregen B, Hohl A, Reis J. Determination of serum amantadine by liquid chromatography-tandem mass spectrometry. Clin him Acta 359(1–2), 125–31 (2005).
17. Wang P, Liang Y-Z, Chen B-M, et al. Quantitative determination of amantadine in human plasma by liquid chromatography-mass spectrometry and the application in a bioequivalence study. J Pharm and Biomed Anal 43(4), 1519–25 (2007). [CrossRef]
18. Feng S, Tian Y, Zhang Z, Zhang J, Huang M, Chen Y. Rapid simultaneous determination of paracetamol, amantadine hydrochloride, caffeine and chlorpheniramine maleate in human plasma by liquid chromatography/tandem mass spectrometry. Arzneimittelforschung. 59(2), 86–95 (2009).
19. Wu J, Wang D, He Z. Determination of amantadine in human plasma by LC-MS/MS and its pharmacokinetics. Chin J Clin Pharm 17, 109–111 (2008).
20. Sachdev KK, Singh N, Krishnamoorthy MS. Juvenile Parkinsonism Treated With Levodopa. Arch Neurol 34(4), 244–245 (1977). [CrossRef]
21. Uc EY, Rodnitzky RL. Juvenile parkinsonism. Semin Pediatr Neurol 10(1), 62–67 (2003). [CrossRef]
22. Thomsen TR, Rodnitzky RL. Juvenile parkinsonism: Epidemiology, diagnosis and treatment. CNS Drugs 24(6), 467–477 (2010). [CrossRef]
23. Ware TL, Srinivasan J, Gonzalez L, et al. Juvenile Parkinsonism. J Paediatr Child Health 49(5), 409–411 (2013). [CrossRef]
24. Hayden FG, Minocha A, Spyker DA, Hoffman HE. Comparative single-dose pharmacokinetics of amantadine hydrochloride and rimantadine hydrochloride in young and elderly adults. Antimicrob Agents and Chemother 28(2), 216–221 (1985). [CrossRef]
25. Nishikawa N, Nagai M, Moritoyo T, Yabe H, Nomoto M. Plasma amantadine concentrations in patients with Parkinson’s disease. Parkinsonism Relat Disord 15(5), 351–3 (2009). [CrossRef]
26. Tsuruoka Y, Nakajima T, Hashimoto T, et al. Determination of Amantadine in Poultry Tissues and Egg by LC-MS/MS. Food Hyg Safe Sci 56(3), 83–87 (2015). [CrossRef]
27. Food and Drug Administration. Guidance for Industry: Bioanalytical Method Validation. U.S. Department of Health and Human Services. (May), 4–10 (2001).
28. Viswanathan CT, Bansal S, Booth B, et al. Quantitative bioanalytical methods validation and implementation: Best practices for chromatographic and ligand binding assays. Pharm Res 24(10), 1962–1973 (2007). [CrossRef]
All site content, except where otherwise noted, is licensed under a Creative Commons Attribution 4.0 License
