OPEN-ACCESS PEER-REVIEWED
ORIGINAL RESEARCH
Morse Faria1,*, Omnia A. Ismaiel1,2, James Waltrip1, Tom Mariannino1, Moucun Yuan1, William Mylott1, Vikram Roongta3, Jim X. Shen3, Pathanjali Kadiya3
1Chromatographic Services, PPD Laboratories, Richmond, Virginia 23230, USA. 2Department of Analytical Chemistry, Faculty of Pharmacy, Zagazig University, Zagazig 44519, Egypt. 3Bioanalytical Sciences, Research & Development, Bristol-Myers Squibb, Princeton, New Jersey 08543, USA.
Journal of Applied Bioanalysis. Vol.6. No.3. pages 145-163 (2020).
Published 15 August 2020. https://doi.org/10.17145/jab.20.015 | (ISSN 2405-710X).
Correspondence: Faria M. . PPD Laboratories, 2244 Dabney Road, Richmond, VA 23230, USA. Phone: +1 804 977 849.
Citation:
Faria M, Ismaiel OA, Waltrip J, Mariannino T, Yuan M, Mylott W, Roongta V, Shen JX, Kadiyala P. LC-MS/MS Method for the Quantitative Determination of Tanespimycin and its Active Metabolite in Human Plasma: Method Validation and Overcoming an Insidious APCI Source Phenomenon. J Appl Bioanal 6(3), 145-163 (2020).
Open-access and Copyright:
©2020 Faria M et al. This article is an open access article distributed under the terms of the Creative Commons Attribution License (CC-BY) which permits any use, distribution, and reproduction in any medium, provided the original author(s) and source are credited.
Funding/Manuscript writing assistance:
The authors have no financial support or funding to report and they also declare that no writing assistance was utilized in the production of this article.
Competing interest:
The authors have declared that no competing interest exist.
Article history:
Received: 01 February 2020, Revised 28 July 2020, Accepted 31 July 2020.
Abstract
OBJECTIVES: To develop a LC-MS/MS method for simultaneous measurement of Tanespimycin (17-(allylamino)-17-demethoxygeldanamycin, BMS-722782, 17-AAG) and its active metabolite 17-(amino)-17-demethoxygeldanamycin (17-AG) in human plasma.
METHODS: The samples were extracted by protein precipitation and analyzed on an LC-MS/MS system using reversed phase chromatography. Ionization was carried out using an Atmospheric Pressure Chemical Ionization (APCI) source.
RESULTS: A sensitive method was developed and validated for the measurement of tanespimycin and its active 17-AG in human plasma using tanespimycin –13C3,15N as an internal standard. The assay was validated over the concentration range of 10.0 to 2500 ng/mL for tanespimycin and 5.00 to 1250 ng/mL for 17-AG. During method development, an internal standard variability due to an in-source reduction of the quinone moiety during ionization was observed. The in-source reduction was mitigated by selection of appropriate mobile phases, internal standard concentration, injection volume, source temperature, and continuous maintenance of the source between runs.
CONCLUSION: This paper describes a validated method to simultaneously measure tanespimycin and its active metabolite in human plasma by LC-MS/MS. In addition, this paper describes various approaches to mitigate the impact of in-source reduction during APCI ionization.
Keywords
17-AAG, 17-AG, BMS-722782, Tanespimycin, LC-MS/MS, protein precipitation, APCI, In-source reduction, Quinone.
Introduction
Tanespimycin [(17-(allylamino)-17-demethoxygeldanamycin), BMS-722782, 17-AAG] is a synthetic geldanamycin analog [1]. Geldanamycin is a type of benzoquinone ansamyacin [2,3] that is naturally produced by yeast [4]. Tanespimycin has been studied for its use as an anticancer drug [5,6].
The active metabolite for tanespimycin is 17-amino-17-demethoxygeldanamycin (17-AG), and is produced when the carbon-nitrogen bond associated with the 17 position is broken via an oxidation reaction catalyzed by CYP3A4, the cytochrome P450 isoform [5,7] resulting in the loss of propylene. 17-AG is less toxic and has a longer-half life than tanespimycin, which makes it a good candidate to study for its anti-cancer potential [8].
Heat shock protein 90 (HSP90) is a molecular chaperone for many cellular proteins involved in cell signaling, proliferation, and survival [1]. Many client proteins of HSP90, such as ErbB2/Her2, Raf-1, Akt/PKB, CDK4, Polo-1, mutant p53 and human telomerase reverse transcriptase, are involved in the formation of malignant tumors [1]. The ATP-binding pocket of heat shock protein 90 (HSP90) can be inhibited by tanespimycin [9] and 17-AG [5, 8]. When tanespimycin and 17-AG are bound to HSP90, the HSP90-mediated actions are blocked and its client protein degrades [9]. Although HSP90 is present in normal cells, it is inactive and exists in an uncomplexed structure that demonstrates low ATP activity [10]. However, in malignant cells, HSP90 has high ATPase activity in an activated multi-chaperone formation [10]. As compared to HSP90 ATP-binding sites in normal cells, tanespimycin attaches to the HSP90 ATP-binding site in cancer cells with 100 times higher binding affinity [10]. Since tanespimycin and 17-AG bind with equipotency to HSP90 [5], it can be inferred that 17-AG also has 100 times higher binding affinity for the ATP-binding site of HSP90 in malignant cells [6]. Therefore, both tanespimycin and its metabolite are good candidates for cancer therapy.
A reliable bioanalytical method for simultaneous measurement of tanespimycin and its active metabolite was required to support potential clinical programs. Due to its well-known sensitivity and selectivity, high performance liquid chromatography with tandem mass spectrometry (LC-MS/MS) has been utilized extensively in bioanalytical method development and validation [11]. There are several papers describing LC-MS/MS bioanalytical methods for compounds similar to tanespimycin such as 17-DMAG [12, 13]. Johnston et al reported a bioanalytical method for measurement of tanespimycin and 17-AG in human plasma by LC-MS/MS using atmospheric pressure chemical ionization (APCI) [6]. Those methods used a chemical analogue as an internal standard (IS), while the method described in this paper used a stable isotope labelled form of tanespimycin as an internal standard for both analytes.
In this paper, the concentrations of tanespimycin and 17-AG in sodium heparin human plasma were determined via an off-line protein precipitation extraction in combination with APCI LC-MS/MS. The use of stable isotope labeled internal standard posed unique challenges during method development. Inconsistencies were observed when 17-AG was quantified using labeled tanespimycin-13C3,15N as internal standard. Upon investigation, it was concluded that a probable reduction reaction was occurring in the APCI source during ionization. This manuscript describes various measures undertaken to address the in-source reduction in order to achieve a rugged method. The bioanalytical method development challenges that are discussed in this paper are unique in that they represent interesting circumstances, specifically for tanespimycin and 17-AG, which have not been described for these compounds in previous publications, to the authors’ knowledge. The concepts relayed here for tanespimycin and 17-AG can find applications during bioanalytical method development of other compounds having similar quinone structures. The method developed and validated in this manuscript is simple, sensitive, reliable, rapid, and robust.
Experimental
Materials
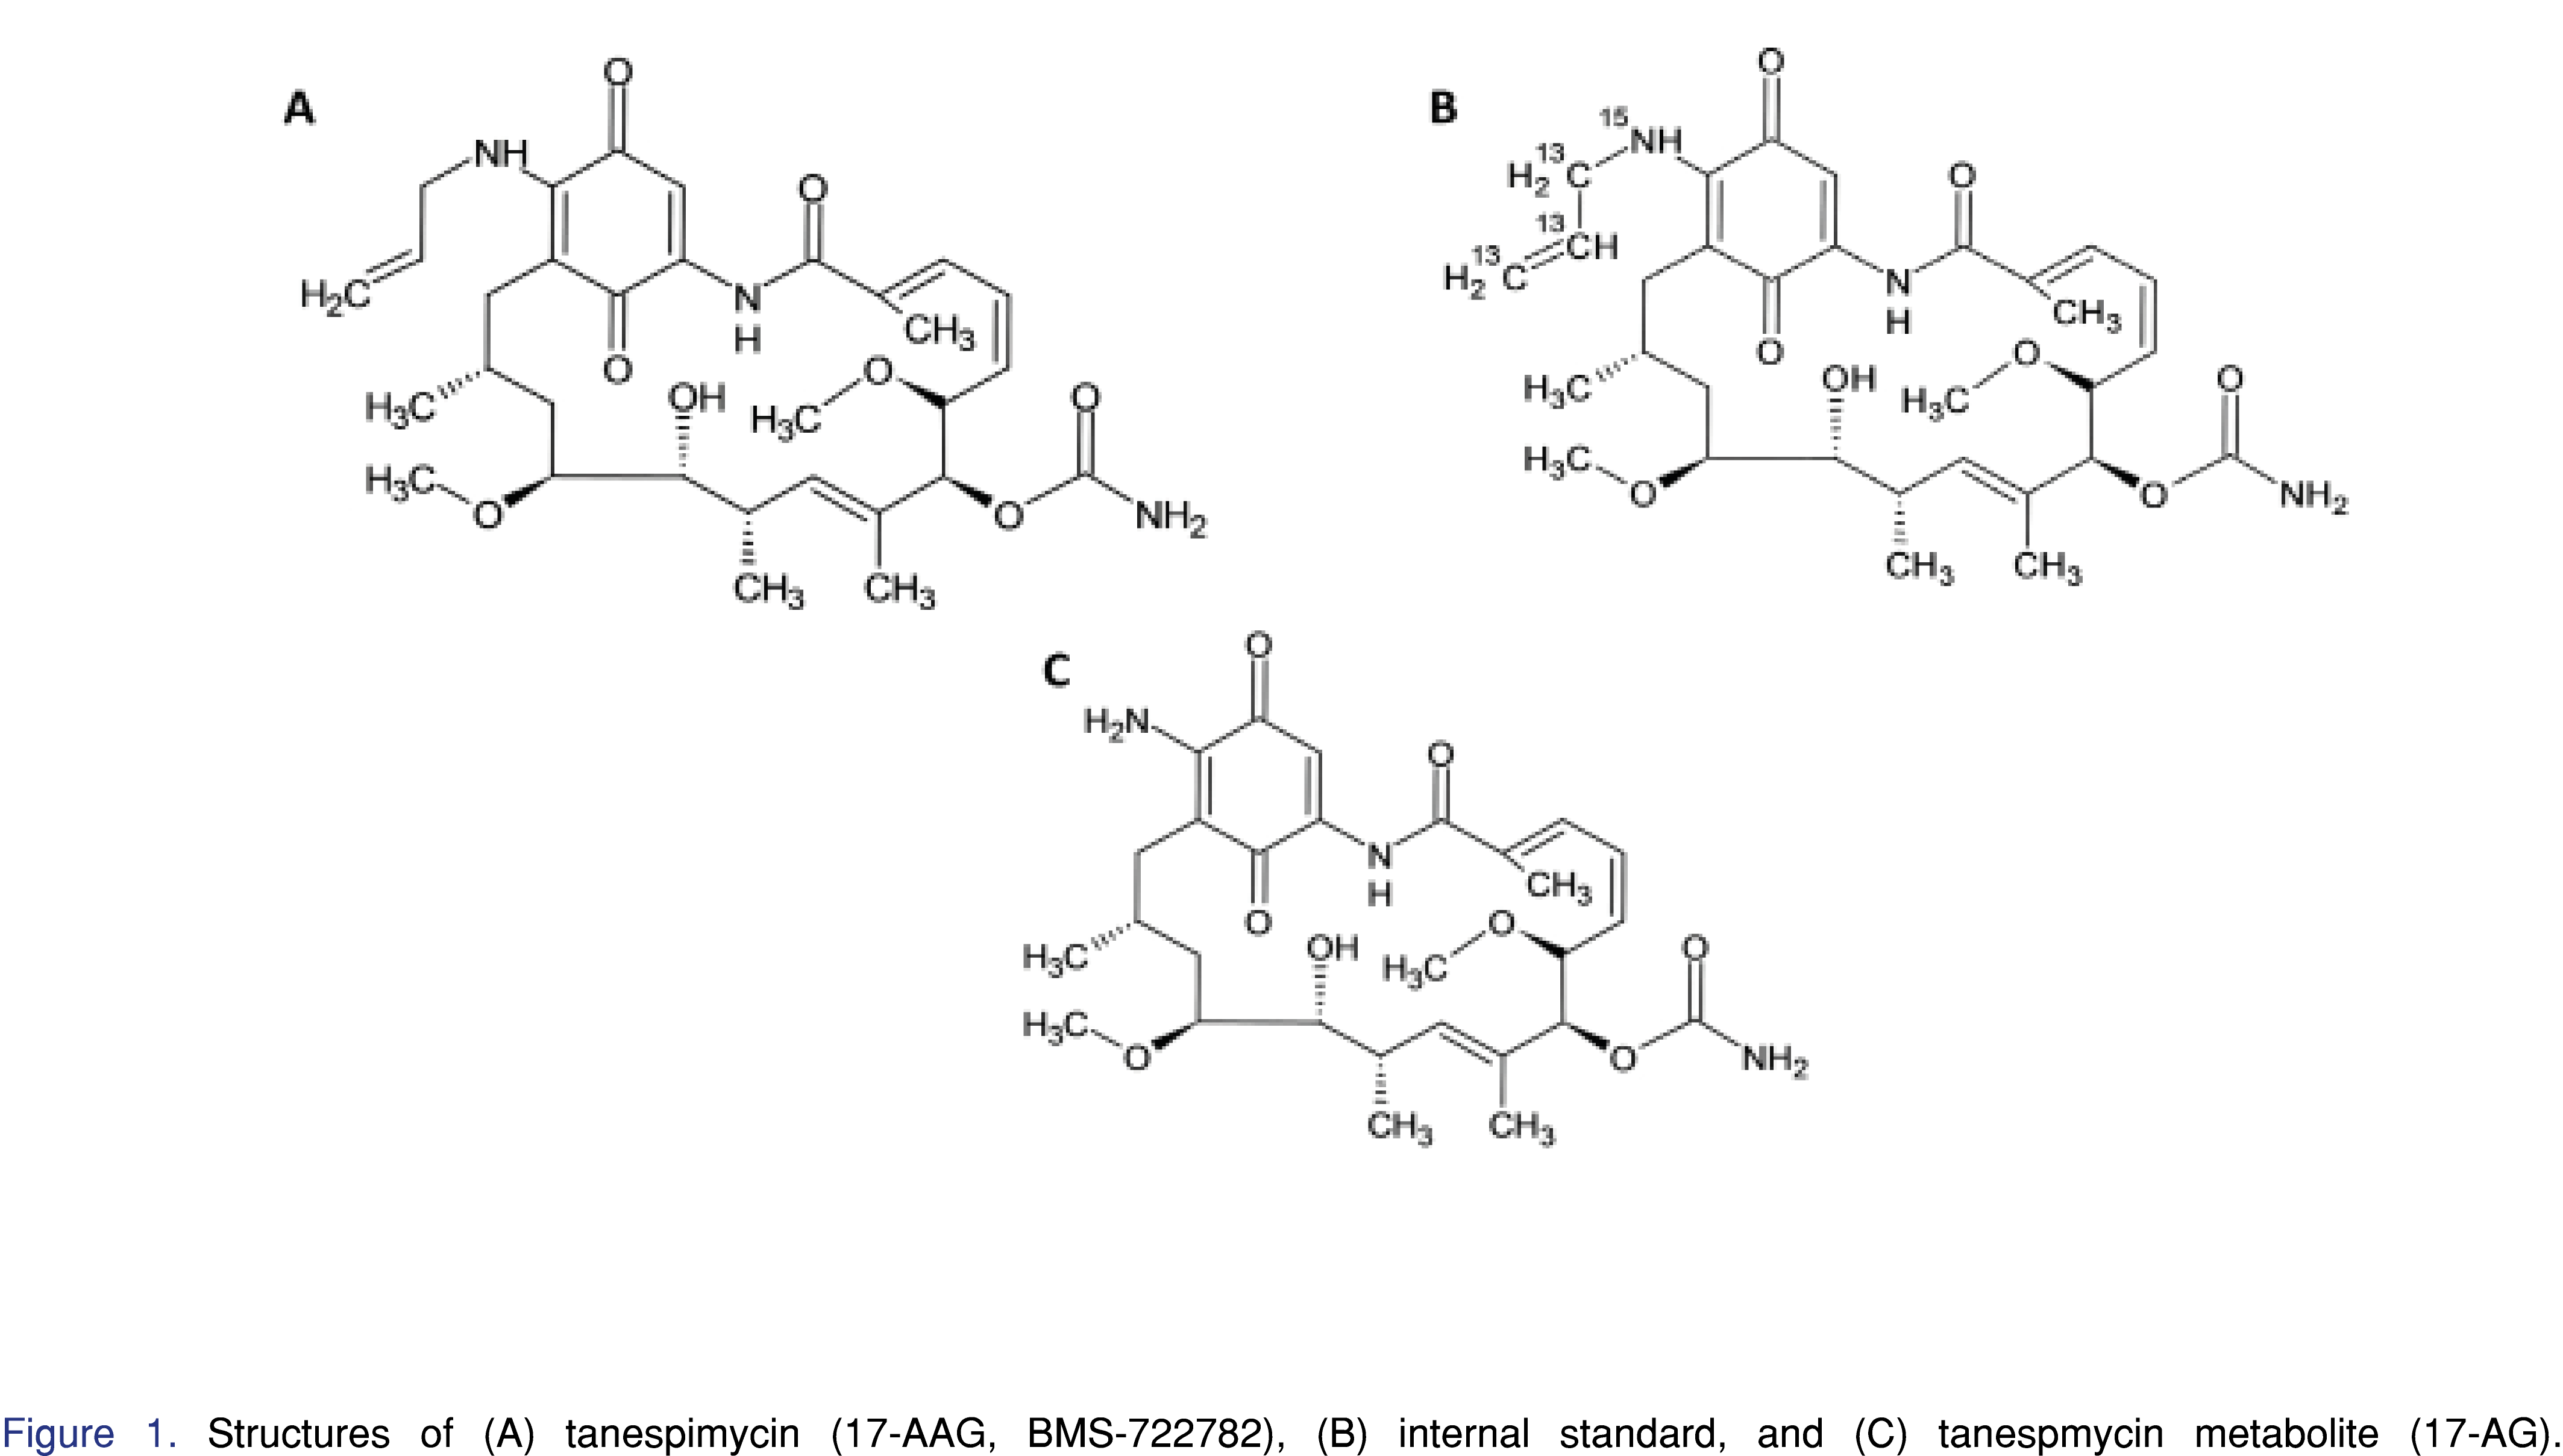
BMS-722782 (tanespimycin, 17-AAG) (99.2% purity), tanespimycin-13C3,15N, (100% purity) and 17-AG (98.1% purity) (Figures 1A, 1B, and 1C, respectively) were obtained from Bristol-Myers Squibb (Princeton, NJ, USA). Tanespimycin-13C3,15N is isotopically labeled and was used as the internal standard for this assay. HPLC-grade acetonitrile and methanol were purchased from Burdick & Jackson (Morristown, NJ, USA). Glacial acetic acid was purchased from Mallinckrodt (Hazelwood, MO, USA). Reagent water was obtained from an in-house Milli-Q system (Billerica, MA, USA). Control human plasma (sodium heparin) was purchased from BioChemed (Winchester, VA, USA).
Instrumentation
The HPLC system consisted of a Shimadzu System Controller (Model SCL-10A Vp), three Binary Pumps (Model LC 10AD Vp), solvent degasser (Model DGU-14A; Shimadzu Scientific Instrument, Columbia, MD, USA), one binary Agilent 1100 pump (Agilent, Santa Clara, CA, USA), and two 10-port Valco valves (Model EHMA, VICI Valco Instruments Co. Inc., Houston, TX, USA). A CTC Analytics PAL autosampler (CTC Analytics, Zingen, Switzerland) was used for sample injection. A Sciex API 4000 mass spectrometer (Sciex, Toronto, Canada) was used as the detector. A Tomtec robotic liquid-handling system (Hamden, CT, USA) was used during the sample preparation. The data were collected and processed using Analyst software v. 1.4.2 (Sciex, Toronto, Canada).
Chromatographic Conditions
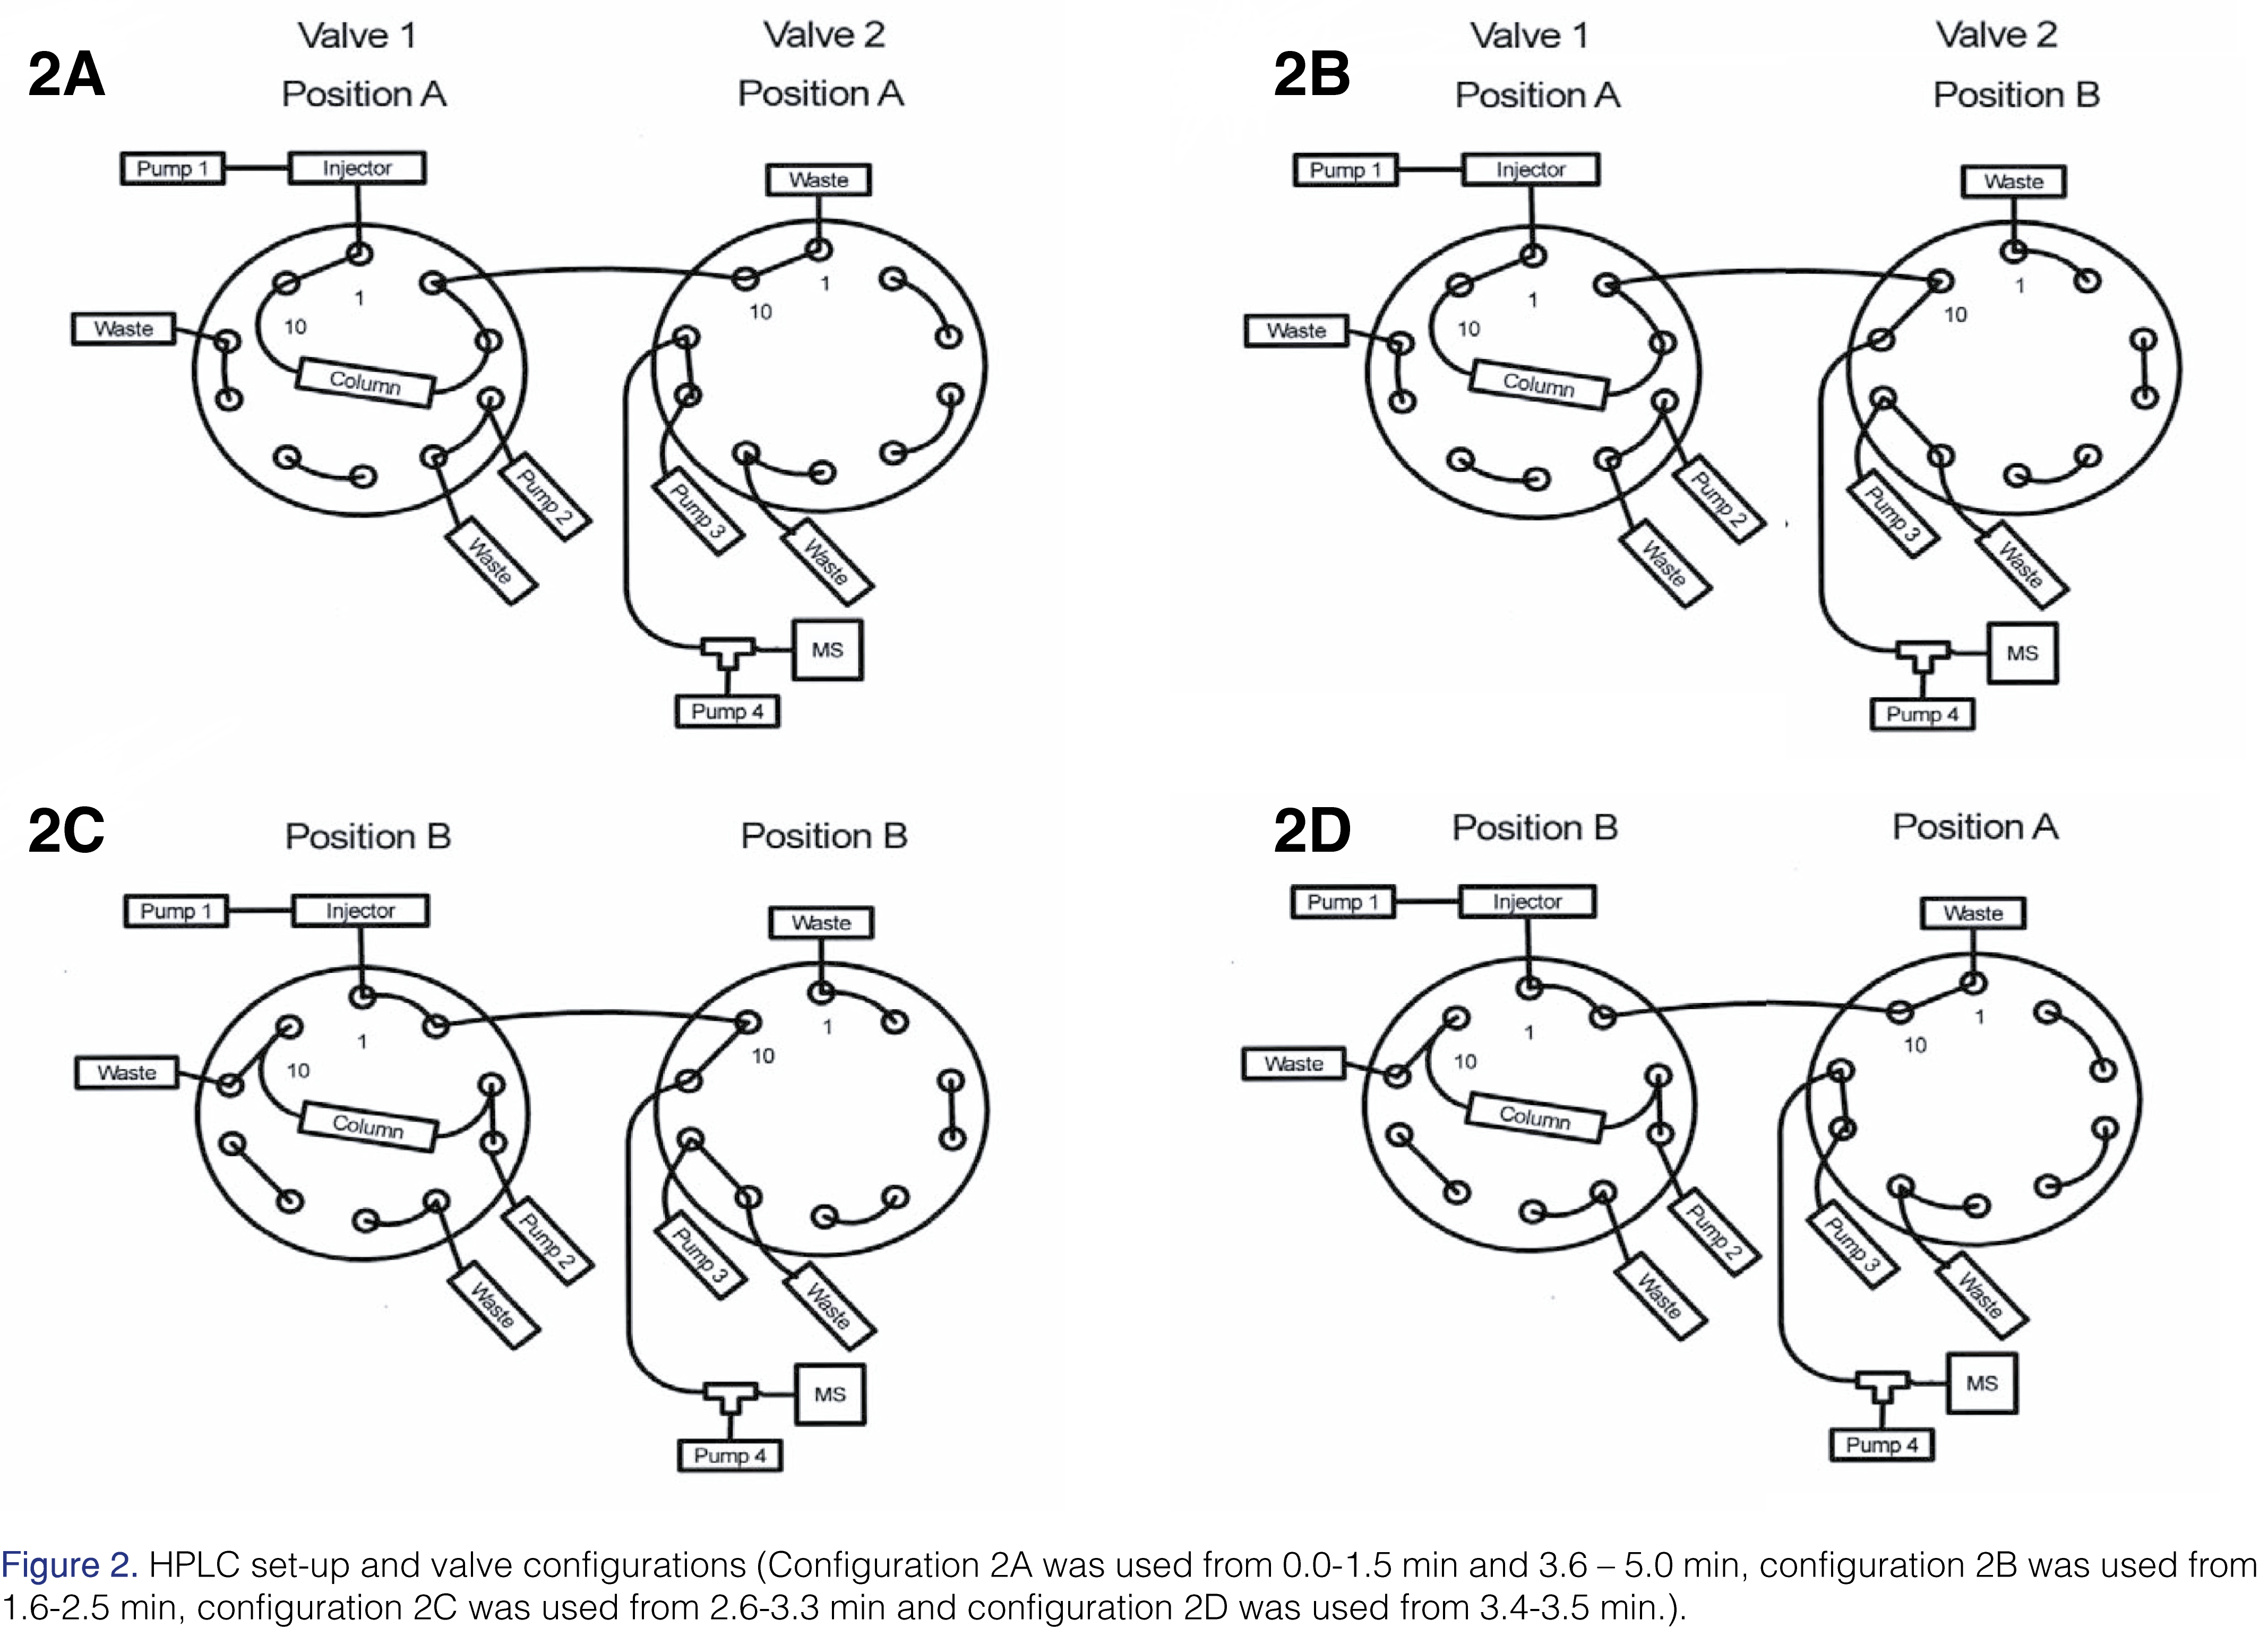
Tanespimycin, 17-AG, and tanespimycin –13C3,15N were separated on a 2.1 mm x 20 mm XBridge BEH C18 Intelligent Speed 5 µm column (Waters product number 186003107, Waters Corporation, Milford, MA, USA). The chromatography was performed by gradient elution at room temperature. The mobile phase consisted of water containing 0.1% (v/v) acetic acid as Solvent A, acetonitrile containing 0.1% (v/v) acetic acid as Solvent B, and 90:10:0.1 methanol/acetonitrile/acetic acid, v/v/v as Solvent C. The Agilent binary pump was used as the elution pump and was plumbed to the autosampler (See Figure 2). The components were eluted with a gradient system initially at 25% B for 1 min, 25% to 80% B in 1.2 min, 1.3 min at 80% B, 80% B to 25% B in 0.1 min and 1.4 min of equilibration at 25% B. The flow rate was 0.5 mL/min. Two 10-port switching valves were used. The purpose of Valve 1 was to allow the column to be backflushed to waste with solvent C at a flow rate of 0.550 mL/min to remove any endogenous matrix components, including phospholipids, after the analytes had eluted. Backflushing was achieved using the second pump (See Figure 2). The third pump was plumbed to Valve 2 (See Figure 2). It was operated at 100% Mobile Phase B at a flow rate of 0.5 mL/min. The Valve 2 was used to direct the flow from the column to either waste or the ion source, thus reducing the amount of polar matrix components, such as salts, reaching the ion source. Mobile Phase B was tee’d into the effluent flow from the column at 0.50 mL/min using the fourth pump (See Figure 2). This was necessary to reduce the amount of protic solvent introduced into the ion source; its importance will be discussed later. The total flow rate introduced into the source during the elution of analytes was 1.0 mL/min. During the time the column effluent was directed to waste, a total flow of 1.0 mL/min was maintained. The total run time was 5.0 min with retention times for tanespimycin, 17-AG, and tanespimycin –13C3,15N of 2.28, 1.91, and 2.28 min, respectively.
Figures and Tables
[Click to enlarge]
Mass Spectrometer Conditions
The mass spectrometer was a Sciex API-4000 equipped with an APCI source, operated in negative ionization mode, using multiple reaction monitoring (MRM). The mass spectrometer was operated in unit resolution mode, with Q1 and Q3 set at 0.7 Da full width at half maximum (FWHM). The optimized APCI and MS/MS conditions were as follows: nitrogen gas supply, source temperature 425°C, nebulizer current -3.0 µA, collision-activated dissociation (CAD) gas setting of 8.0, curtain (CUR) gas setting of 25.0, and a setting of 30.0 for the nebulizer gas (GS1). The declustering potential (DP) was set to -75 V for tanespimycin and tanespimycin-13C3,15N, and at -80 V for 17-AG. The entrance potential (EP) was set to -10 V. The collision cell exit potential (CXP) was set at -13 V for tanespimycin and tanespimycin-13C3,15N and -11 V for 17-AG. The collision energy (CE) was set at 30 eV for tanespimycin and tanespimycin-13C3,15N and 33 eV for 17-AG. It is important to mention that ion source maintenance was necessary to prevent anomalies that impacted quantitation. The ion source maintenance will be described in the discussion section.
The precursor-to-product ion transitions used were 584.4 > 541.3, 588.4 > 545.3 and 544.4 > 501.4 for tanespimycin, tanespimycin-13C3,15N, and 17-AG, respectively, and each had a dwell time of 100 ms. The product ions monitored for each analyte and internal standard represents the cleavage of the CONH2 group from the ring [6].
Standards and Quality Controls (QC)
Calibration standards and quality control samples were prepared using two different verified standard stock solutions. Tanespimycin and 17-AG stock solutions have been demonstrated to be stable for up to 50 days when prepared in methanol and stored at -20 °C in amber glass.
From the verified standard stock solution, calibration standards were prepared under reduced light conditions in human plasma containing sodium heparin, at tanespimycin concentrations of 10.0 (lower limit of quantitation, LLOQ), 18.0, 30.0, 100, 300, 800, 2000, and 2500 (upper limit of quantitation, ULOQ) ng/mL and 17-AG concentrations of 5.00 (lower limit of quantitation, LLOQ), 9.00, 15.0, 50.0, 150, 400, 1000, and 1250 (upper limit of quantitation, ULOQ) ng/mL. Quality control samples were prepared under reduced light conditions in human plasma, containing sodium heparin, at tanespimycin concentrations of 10.0 (LLOQ QC), 25.0 (low QC), 180 (geometric mean QC), 1250 (medium QC), 1900 (high QC) and 10000 ng/mL (over-the-curve QC) and 17-AG concentrations of 5.00 (LLOQ QC), 12.5 (low QC, 90.0 [geometric mean QC]), 625 (medium QC), 950 (high QC), and 5000 (over-the-curve QC) ng/mL. Calibration standards were prepared fresh on the day of use for each validation run. Calibration standard curves were analyzed in duplicate in each analytical run.
The calibration standards and quality controls described above have a constant tanespimycin to 17-AG concentration ratio. Due to an insidious APCI source phenomenon, which will be described in detail later in this manuscript, additional quality control samples, containing tanespimycin only, were prepared under reduced light conditions in human plasma containing sodium heparin, at nominal concentrations of 25.0 (low QC) and 1900 (high QC) ng/mL. A separate set of quality controls, containing 17-AG only, were prepared at nominal concentrations of 12.5 (low QC) and 950 (high QC) ng/mL. The purpose of the additional quality controls was to demonstrate that varying the concentration ratio of tanespimycin to 17-AG would not impact quantitation.
A tanespimycin-13C3,15N stock solution was prepared at 200 µg/mL in methanol under reduced light conditions. From the 200 µg/mL stock solution, a tanespimycin 13C3,15N working internal standard solution was prepared at 4000 ng/mL in methanol. The tanespimycin-13C3,15N stock solution and working internal standard solution have been demonstrated to be stable for up to 50 days when prepared in methanol and stored at -20°C.
Sample Preparation
Under reduced light conditions, human plasma samples were thawed at room temperature and vortex-mixed to ensure uniformity prior to transferring. A 100 µL volume of each sample was transferred to a 96-well polypropylene plate. A 25 µL volume of 4000 ng/mL working internal standard solution prepared in methanol was added to each sample and briefly vortex-mixed. A 400 µL volume of cold (stored at -20°C) acetonitrile was added to each sample to facilitate protein precipitation. The samples were then vortexed for five minutes and subsequently centrifuged at 4696 x g at 4 °C for 5 minutes. A Tomtec® liquid handling system was used to transfer 200 µL of the resulting supernatant to a new 96-well polypropylene plate containing 200 µL of 0.2% acetic acid. The 96-well plate was then vortex-mixed for five minutes and subsequently centrifuged at 4696 x g at 4°C for 5 minutes. The 96-well plate was stored in the autosampler at 5 °C, and 50 µL was injected onto the column. To reduce any potential carryover, the 50 µL sample loop was overfilled using a 60 µL sample volume during injection [14].
Method Validation
Validation of the method with respect to precision and accuracy was carried out according to the FDA Guidance for Industry: Bioanalytical Method Validation [15]. The precision and accuracy of the method were assessed by analyzing six QC samples containing both analytes. Six replicate samples at each concentration were analyzed in six separate runs. The accuracy was determined by calculating the percentage deviation from their theoretical concentrations (%DFT). The intra- and inter-run assay precision were determined by calculating the %CV values.
Selectivity was established by using twelve individual human sodium heparin lots with and without internal standard to determine whether any endogenous plasma components interfered with the analyte or internal standard. In addition, fortified specificity was evaluated in 12 human sodium heparin lots at LLOQ concentrations of tanespimycin and 17-AG. The extraction efficiency and matrix effects for tanespimycin and 17-AG in human plasma were determined at low-QC and high-QC concentrations for both analytes by comparison of extracted and post spiked samples.
Analyte interference assessment was performed to assess the contribution of tanespimycin, 17-AG, or the internal standard to the peak responses of each other. Analyte interreference check was evaluated using a ULOQ concentration of the two analytes and the internal standard at its level of use. In addition, a non-interference test was performed with bortezomib, a co-administered drug. The low and high tanespimycin /17-AG QC samples were spiked with an bortezomib at a concentration of 1000 ng/mL and analyzed with an acceptance criterion of DFT±15%.
Freshly prepared calibration standard samples were used for all stability assessments. Analyte in stored matrix stability, benchtop stability, freeze-thaw stability, and post-preparative stability (extract stability) of tanespimycin and 17-AG were assessed at low, high, and over-the-curve QC levels. Whole blood stability was evaluated at room temperature and on ice at low-QC and high-QC concentrations for both analytes. Whole blood stability was evaluated by comparing the stability samples stored at room temperature and on ice (for 0.5, 1.0 and 2.0 hours) to the 0 hr samples.
Results and Discussion
Challenges in Assay Development
During method development, a precision and accuracy run was evaluated for with tanespimycin and 17-AG QC samples. The data in this run were well within the precision and accuracy acceptance criteria of ±15% (±20% at the LLOQ) for both analytes.
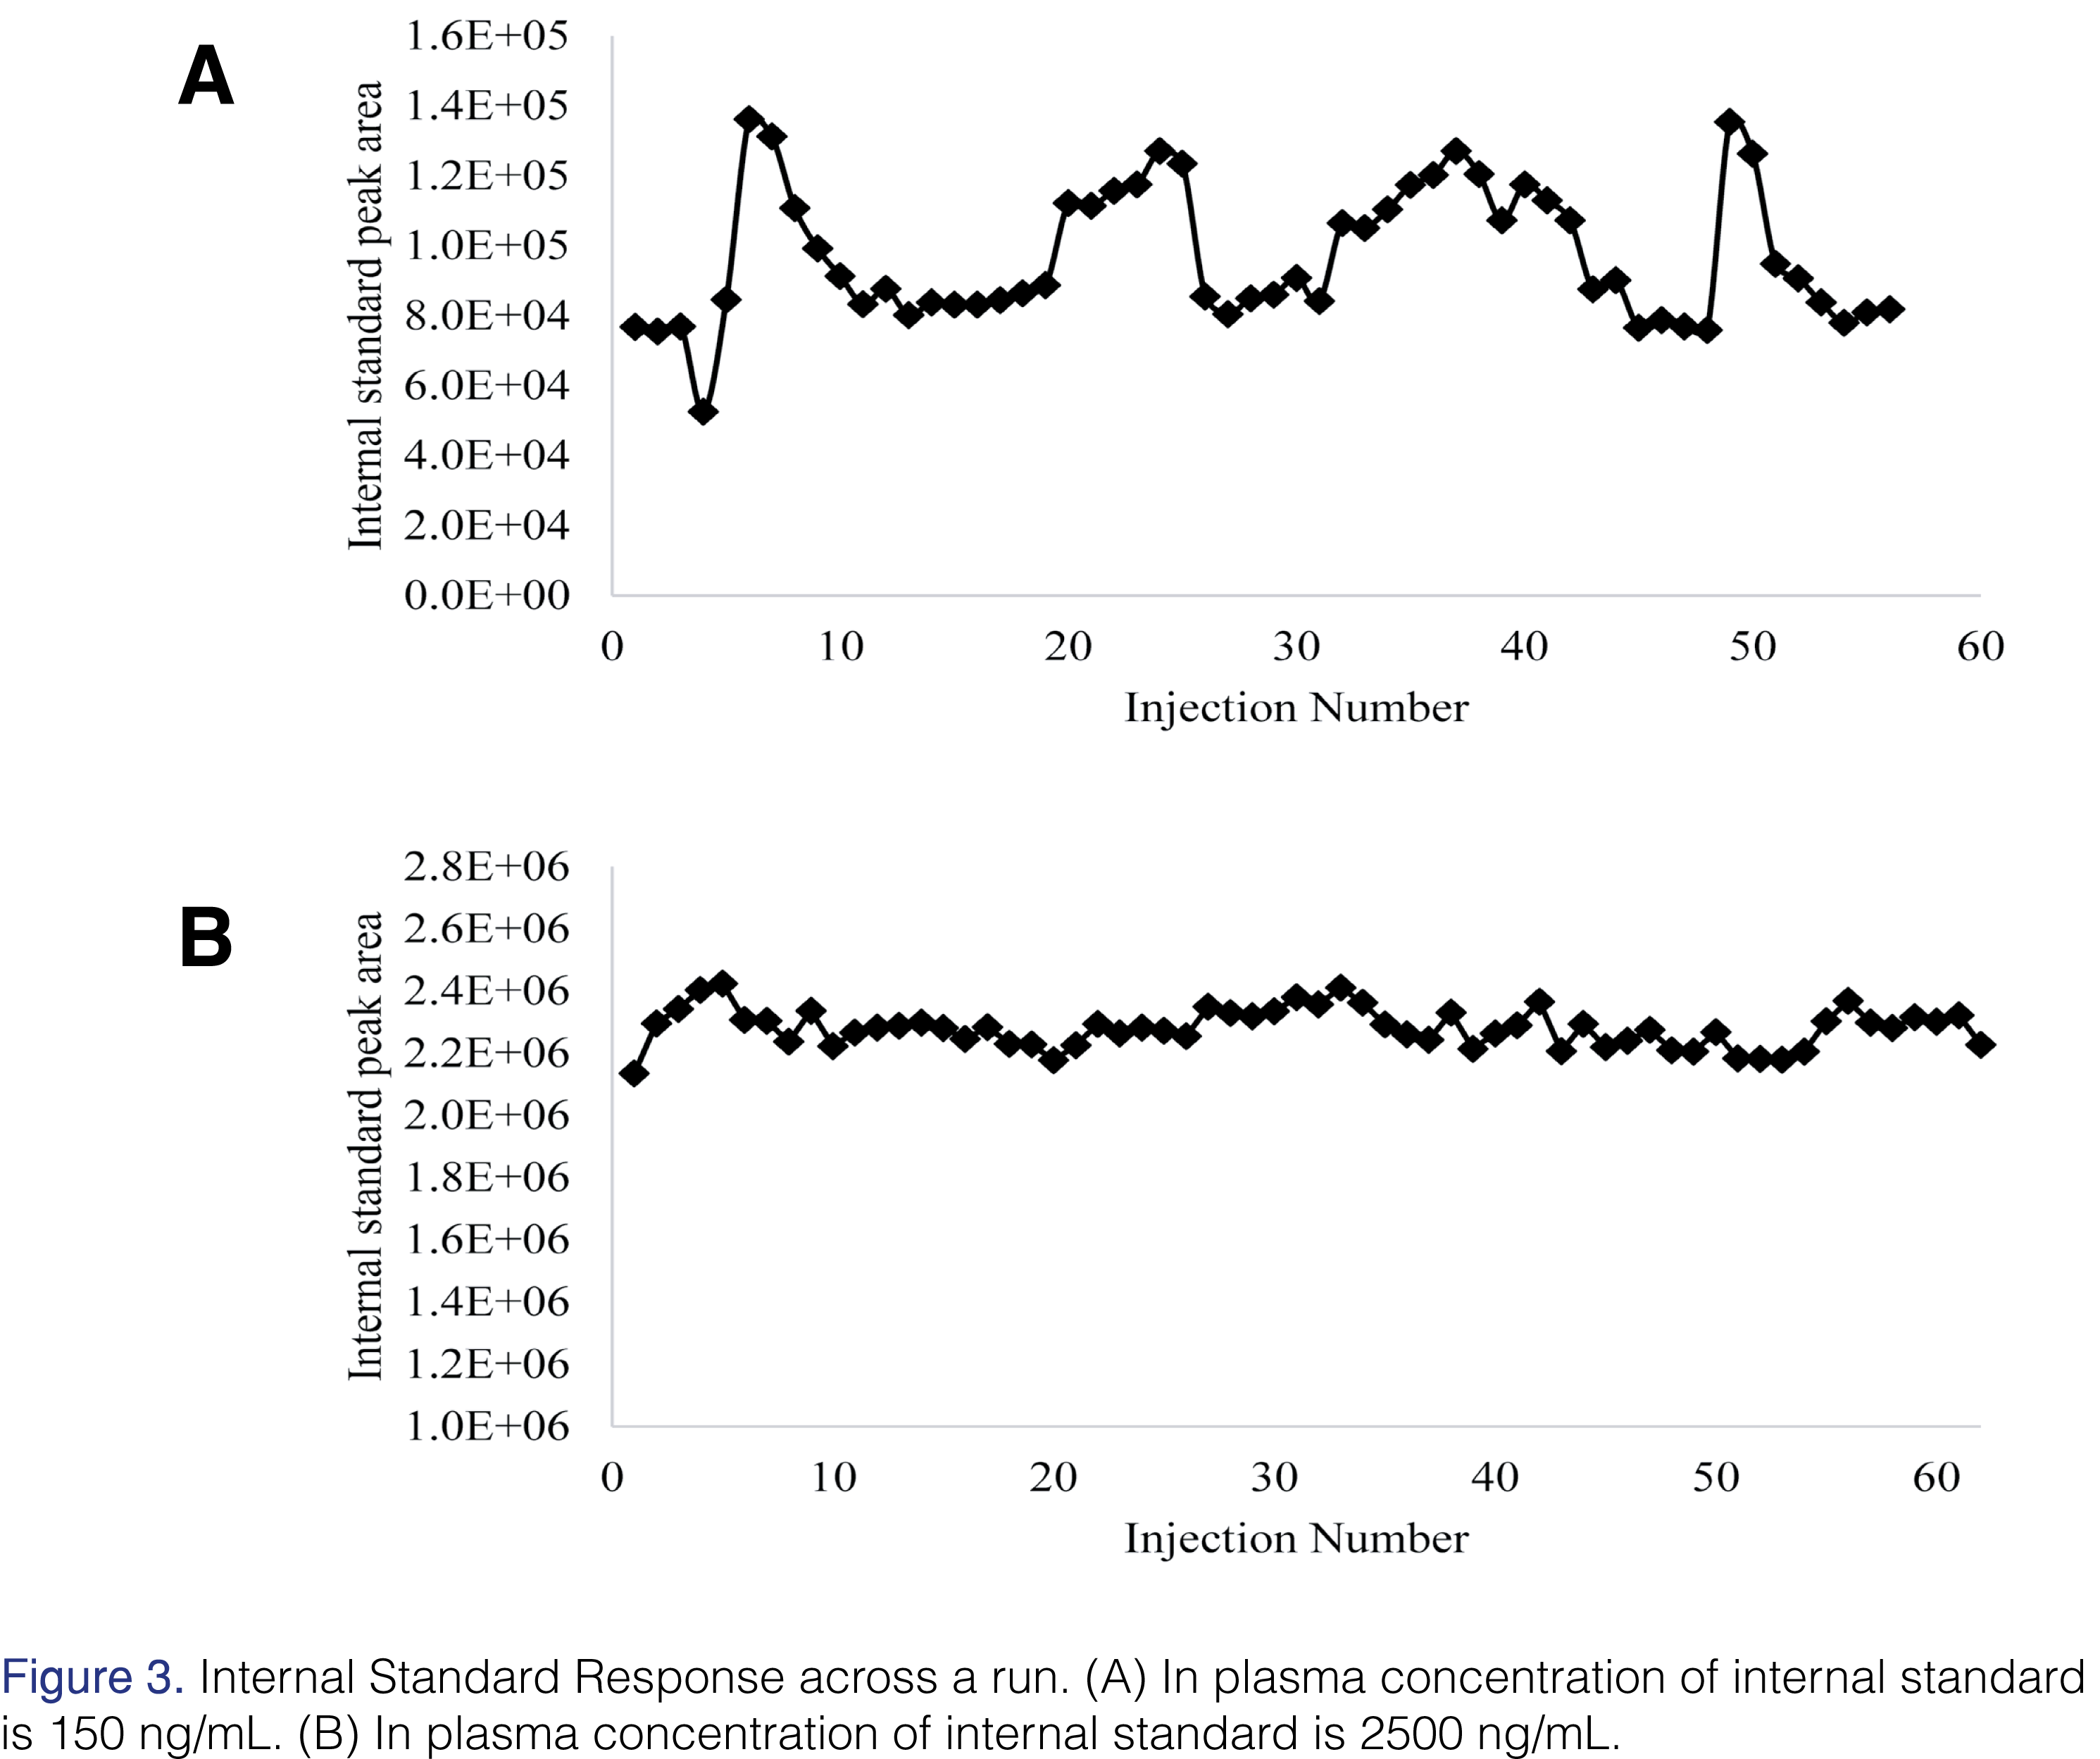
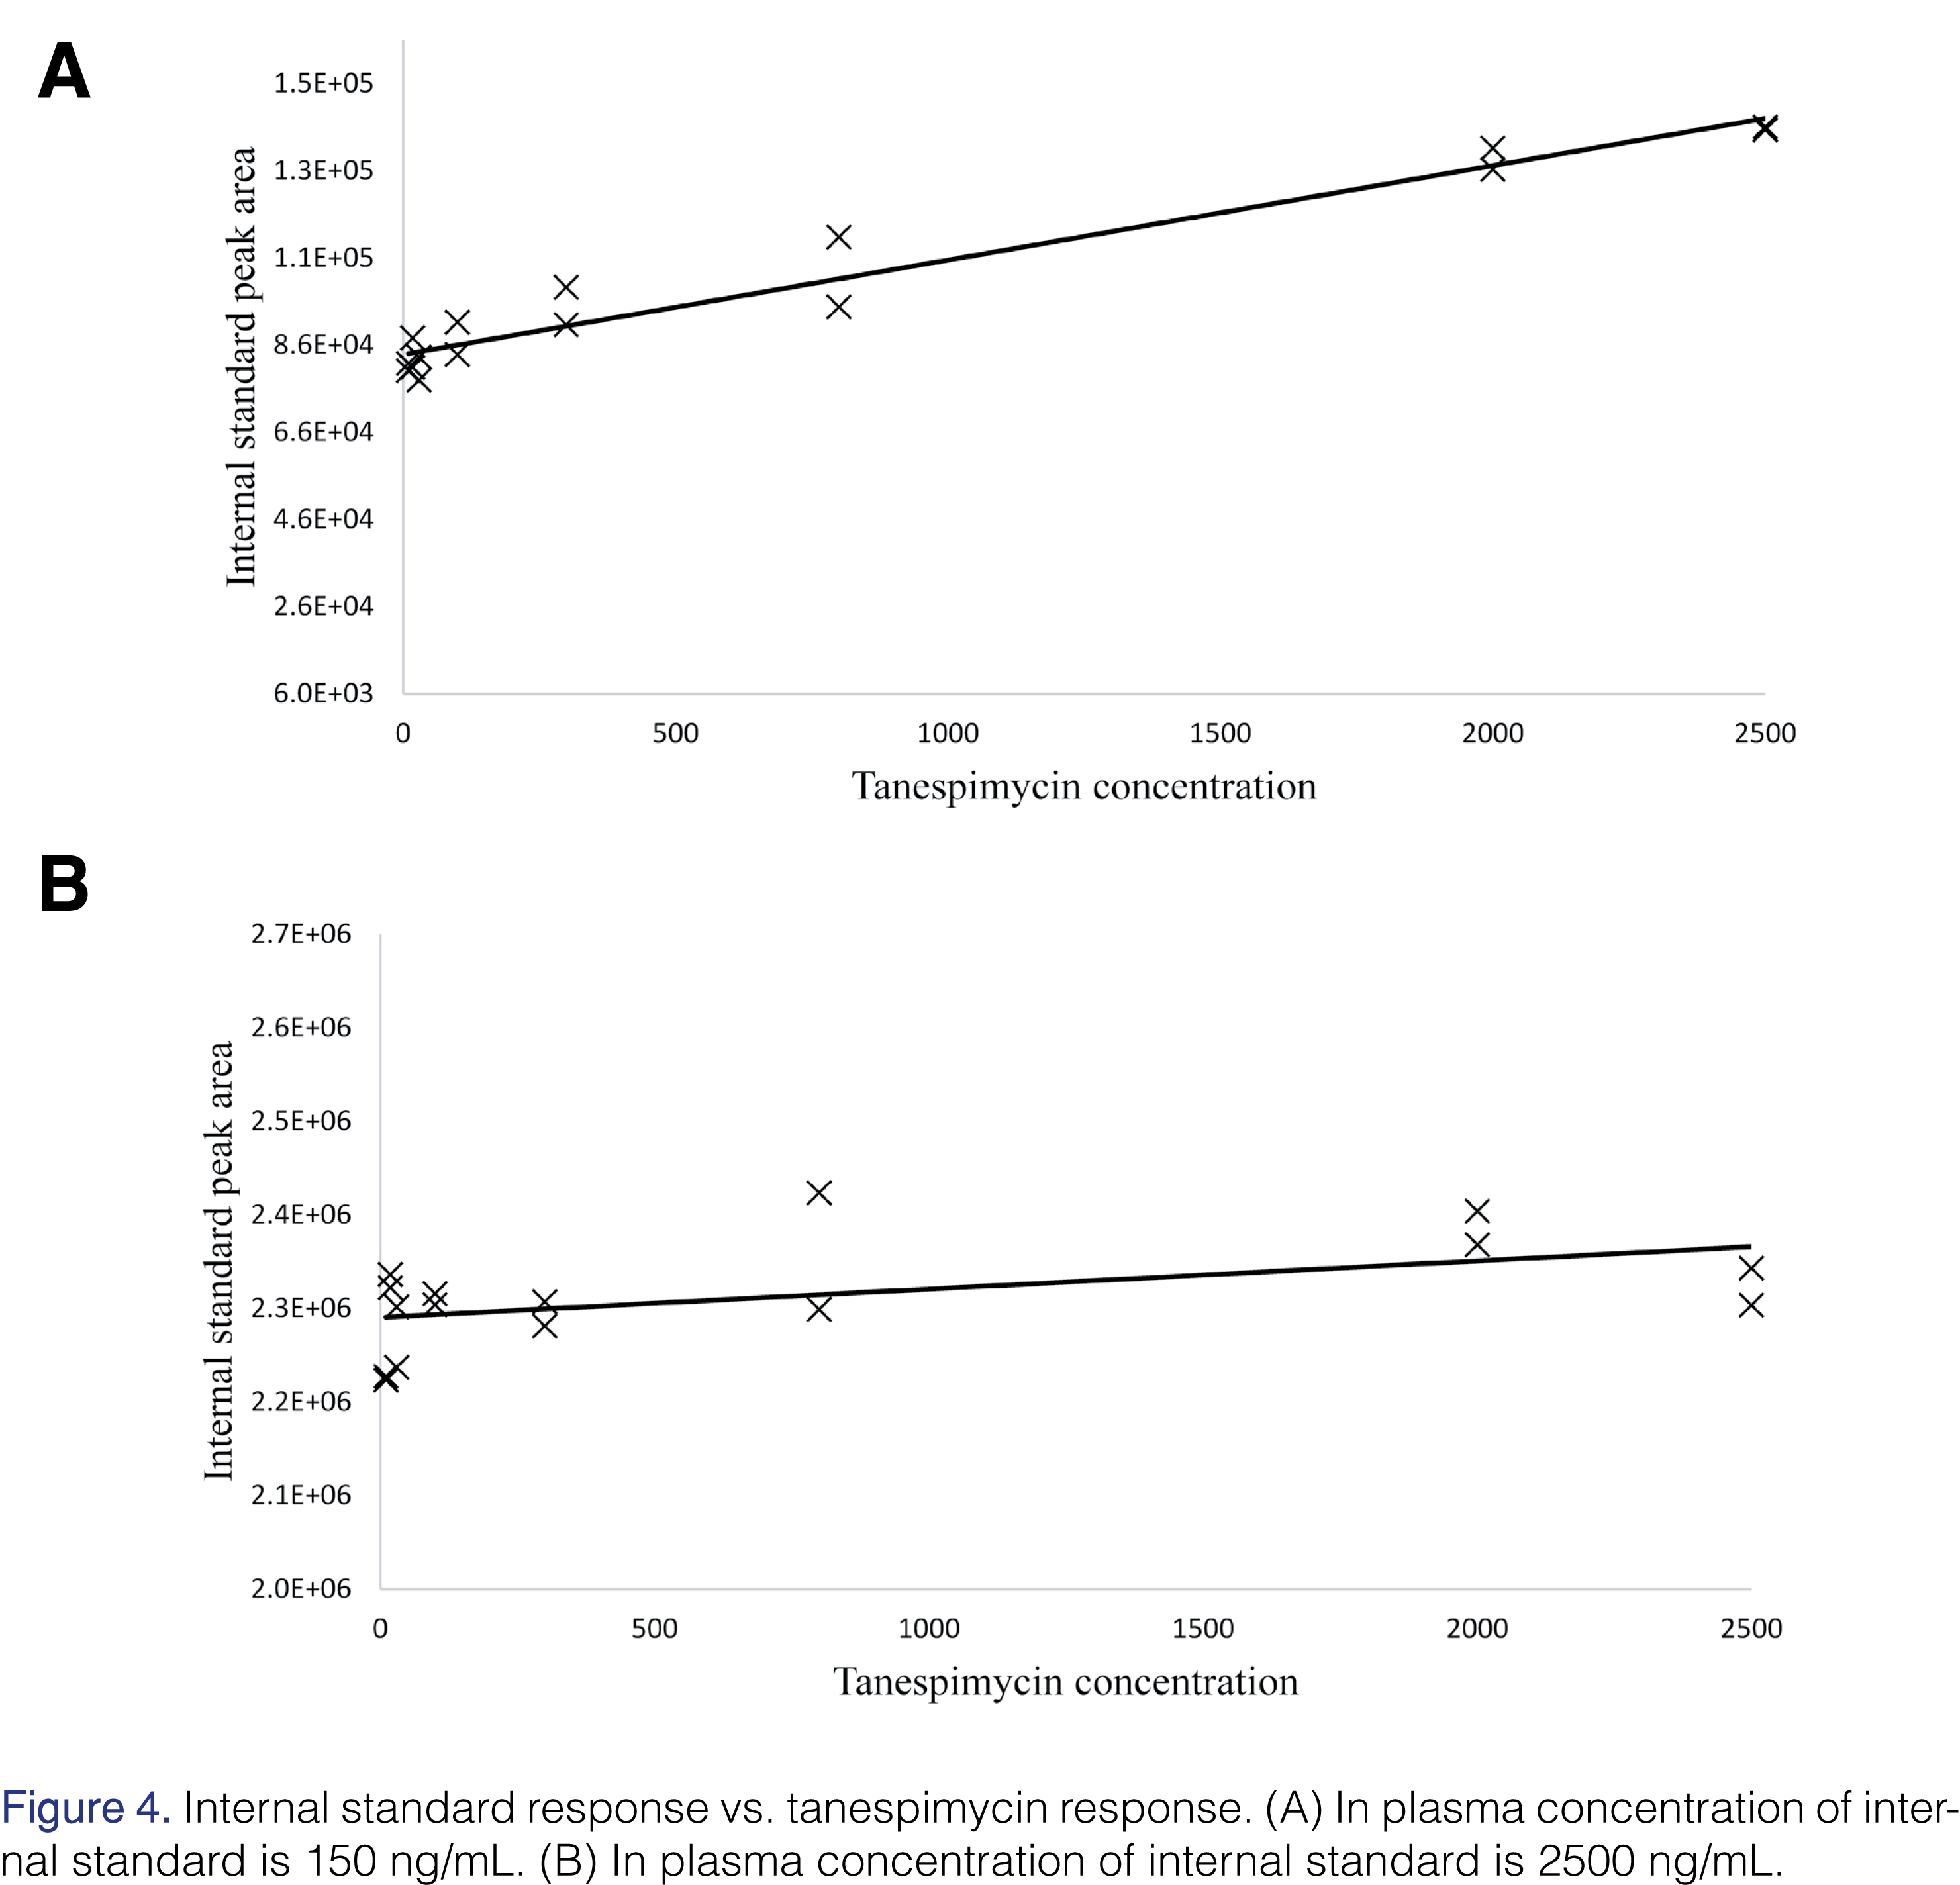
However, upon careful review of the raw data, a surprising trend was observed for the internal standard response across the run (Figure 3A). The internal standard concentration in this analysis was 150 ng/mL in plasma. As the tanespimycin and 17-AG concentration increased so did the internal standard response (Figure 4A). Tanespimycin-13C3,15N was used as the internal standard for both tanespimycin and 17-AG. The possibility of the observed increase in internal standard response being the result of an impurity and or contamination in the tanespimycin and 17-AG reference material was ruled out by analyzing the high calibration standard level with and without internal standard. The contribution from tanespimycin at CAL 8 level to the IS signal response was approximately 0.644%. While all calibration standards and QC samples had produced acceptable results, the impact of the variable internal standard response may have been hidden due to the constant tanespimycin to 17-AG concentration ratio in the calibration standards and QCs. Since unknown samples would not be expected to have a constant tanespimycin to 17-AG concentration ratio, the potential impact needed to be evaluated.
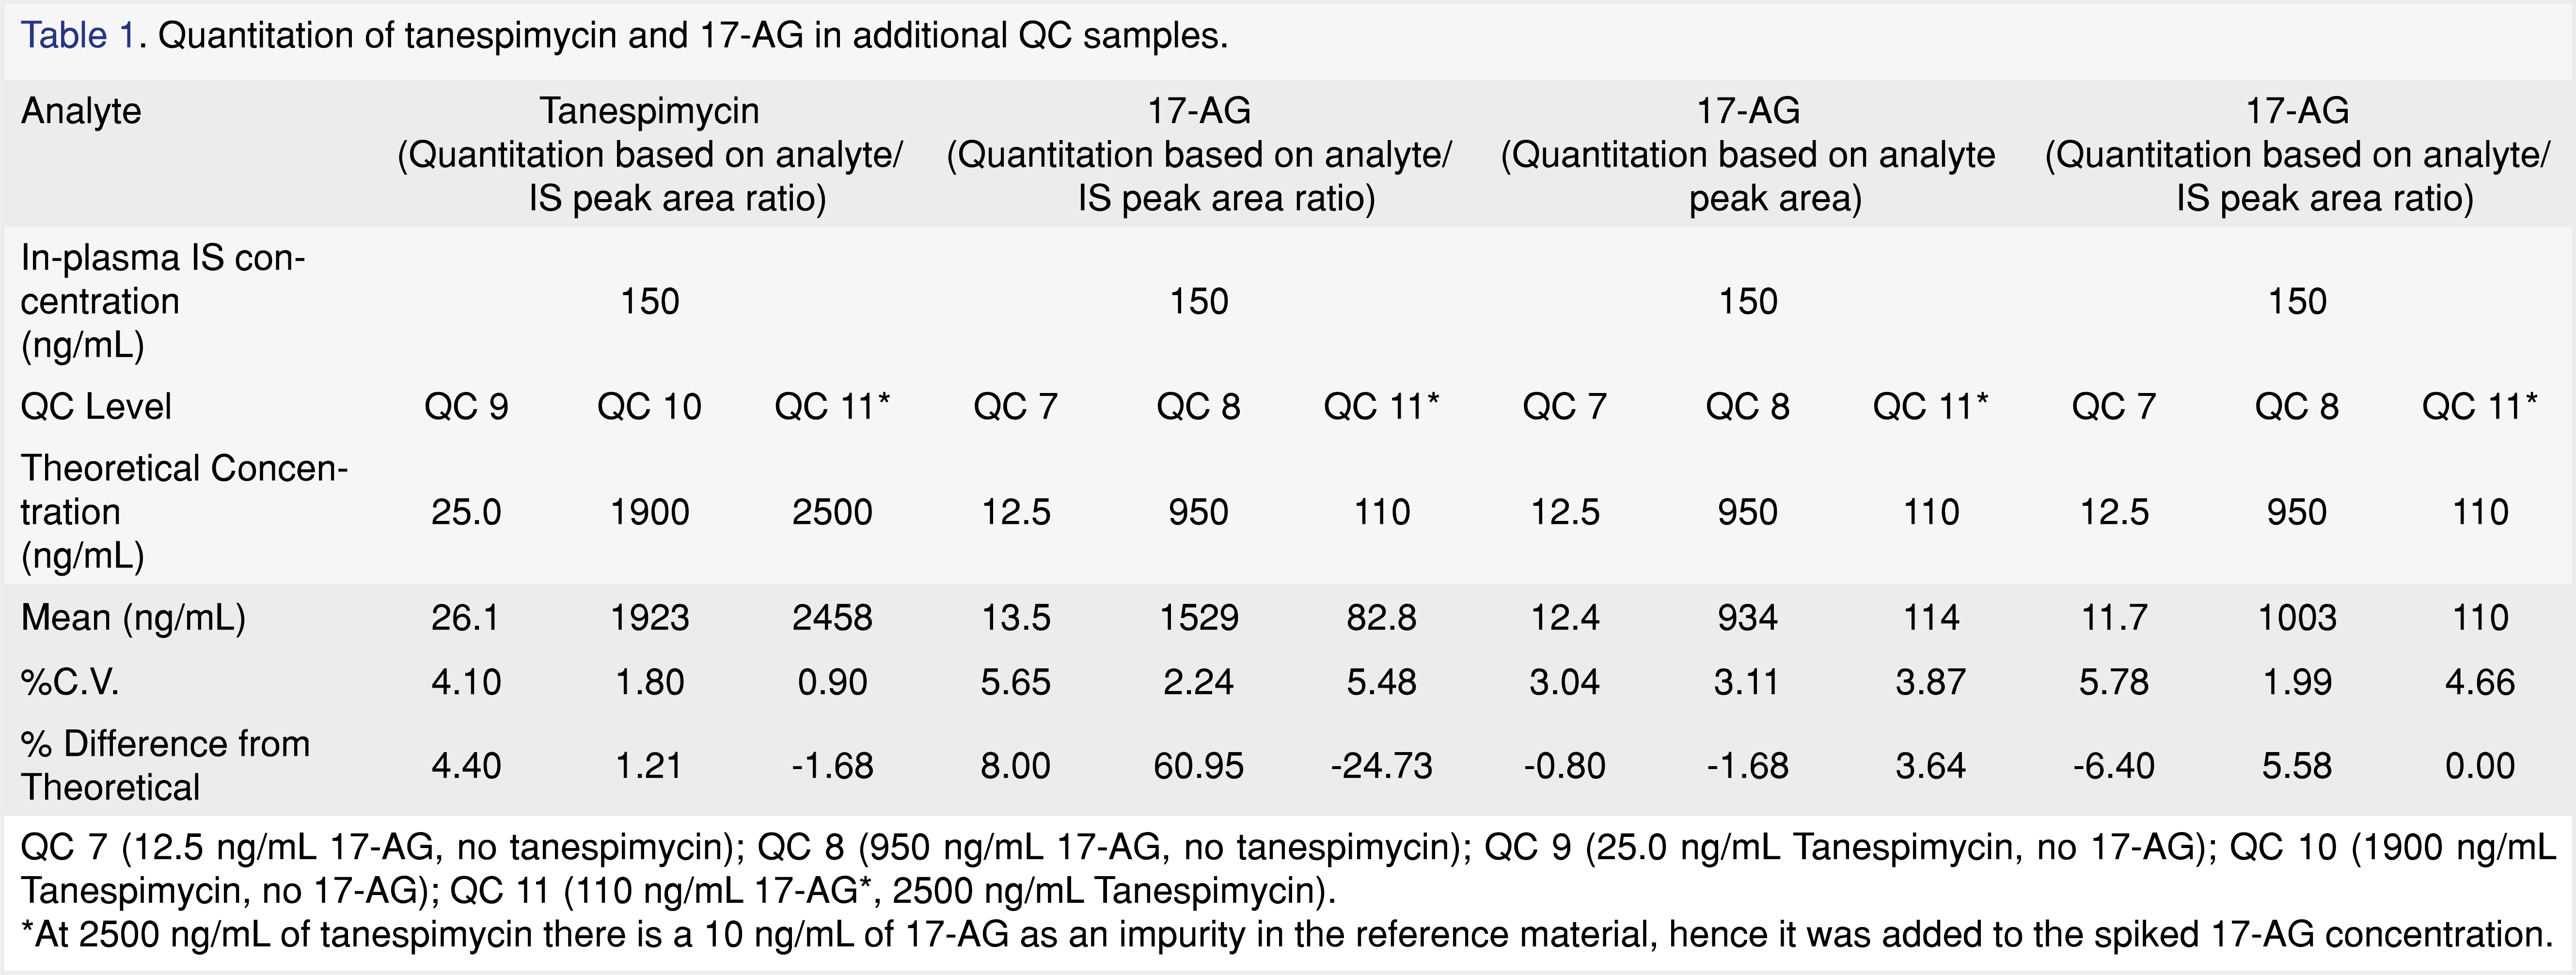
Further investigations were carried out with QC samples containing only tanespimycin at 25.0 (QC 7) and 1900 (QC 8) ng/mL and QC samples containing only 17-AG at 12.5 (QC 9) and 950 (QC 10) ng/mL, as well as QC 11 sample containing 2500 ng/mL tanespimycin and 100 ng/mL 17-AG against a calibration standard samples having a constant 2:1 ratio of tanespimycin:17-AG. At 2500 ng/mL of tanespimycin, an impurity equivalent to 10 ng/mL of 17-AG was observed in the reference material, hence the 17-AG concentration was adjusted to 110 ng/mL in the QC 11 sample. As can be seen from the data in Table 1, the QC samples containing only tanespimycin were well within acceptance criteria, as well as the QC samples containing 2500/110 ng/mL of tanespimycin/17-AG for tanespimycin. However, as can be seen from Table 1, the QC samples containing 17-AG only did not show the same success. The QC sample fortified with 17-AG only at 12.5 ng/mL was within acceptance limits, but the QC sample fortified with 17-AG only at 950 ng/mL had a high bias of 61%. In addition, the QC fortified with 2500/110 ng/mL of tanespimycin/17-AG had a low 17-AG bias of -25%. To rule out the possibility of a preparation error, the QCs were re-evaluated using raw analyte peak areas for 17-AG (Table 1) and were found to be well within acceptance criteria. The results of the above experiments strongly suggested that the increased internal standard response was directly related to the tanespimycin concentration. Therefore, when the Tanespimycin concentration was low relative to 17-AG, a significant positive bias for 17-AG was observed, and likewise, if the tanespimycin concentration was high relative to 17-AG, a significant negative bias for 17-AG was observed. An insidious problem had been uncovered.
Matrix effects, either suppression or enhancement, are generally believed to be less of a concern for APCI [16] (gas phase ionization [17]) than for electrospray ionization [16]. The enhancement of the internal standard response was not due to the presence of matrix components, as demonstrated above, but rather was directly related to the concentration of tanespimycin. A simple recovery test showed that the increased internal standard response was not due to a difference in extraction recoveries between tanespimycin and internal standard. The recovery data showed that only a 16.2% difference in peak area response for the internal standard was observed when tanespimycin was post spiked into a matrix blank sample that was extracted with internal standard, as compared to a matrix blank sample that was extracted with internal standard and not post spiked with tanespimycin.
In-source Reduction Reaction
The structures of tanespimycin, 17-AG and the internal standard share a common chemical moiety, quinone, which can be reduced to semiquinone and/or to dihydroquinone. Since the internal standard and tanespimycin co-elute, a different explanation for the signal enhancement was proposed. The quinone structure that tanespimycin, 17-AG, and the internal standard share is 1,4-Benzoquinone. The quinone structure can undergo reduction to form hydroquinone and semiquinone during ionization [18,19]. It has also been reported that analytes containing aromatic nitro compounds can undergo reduction in the APCI source [17], [20,21]. This reaction is accelerated with the assistance of protic solvents [17,21], such as water, methanol and acetic acid, as well as favorable temperature settings in the source [21]. This reaction is proposed as a proton radical transferring reaction [20–22], which is discussed in more detail later in the paper.
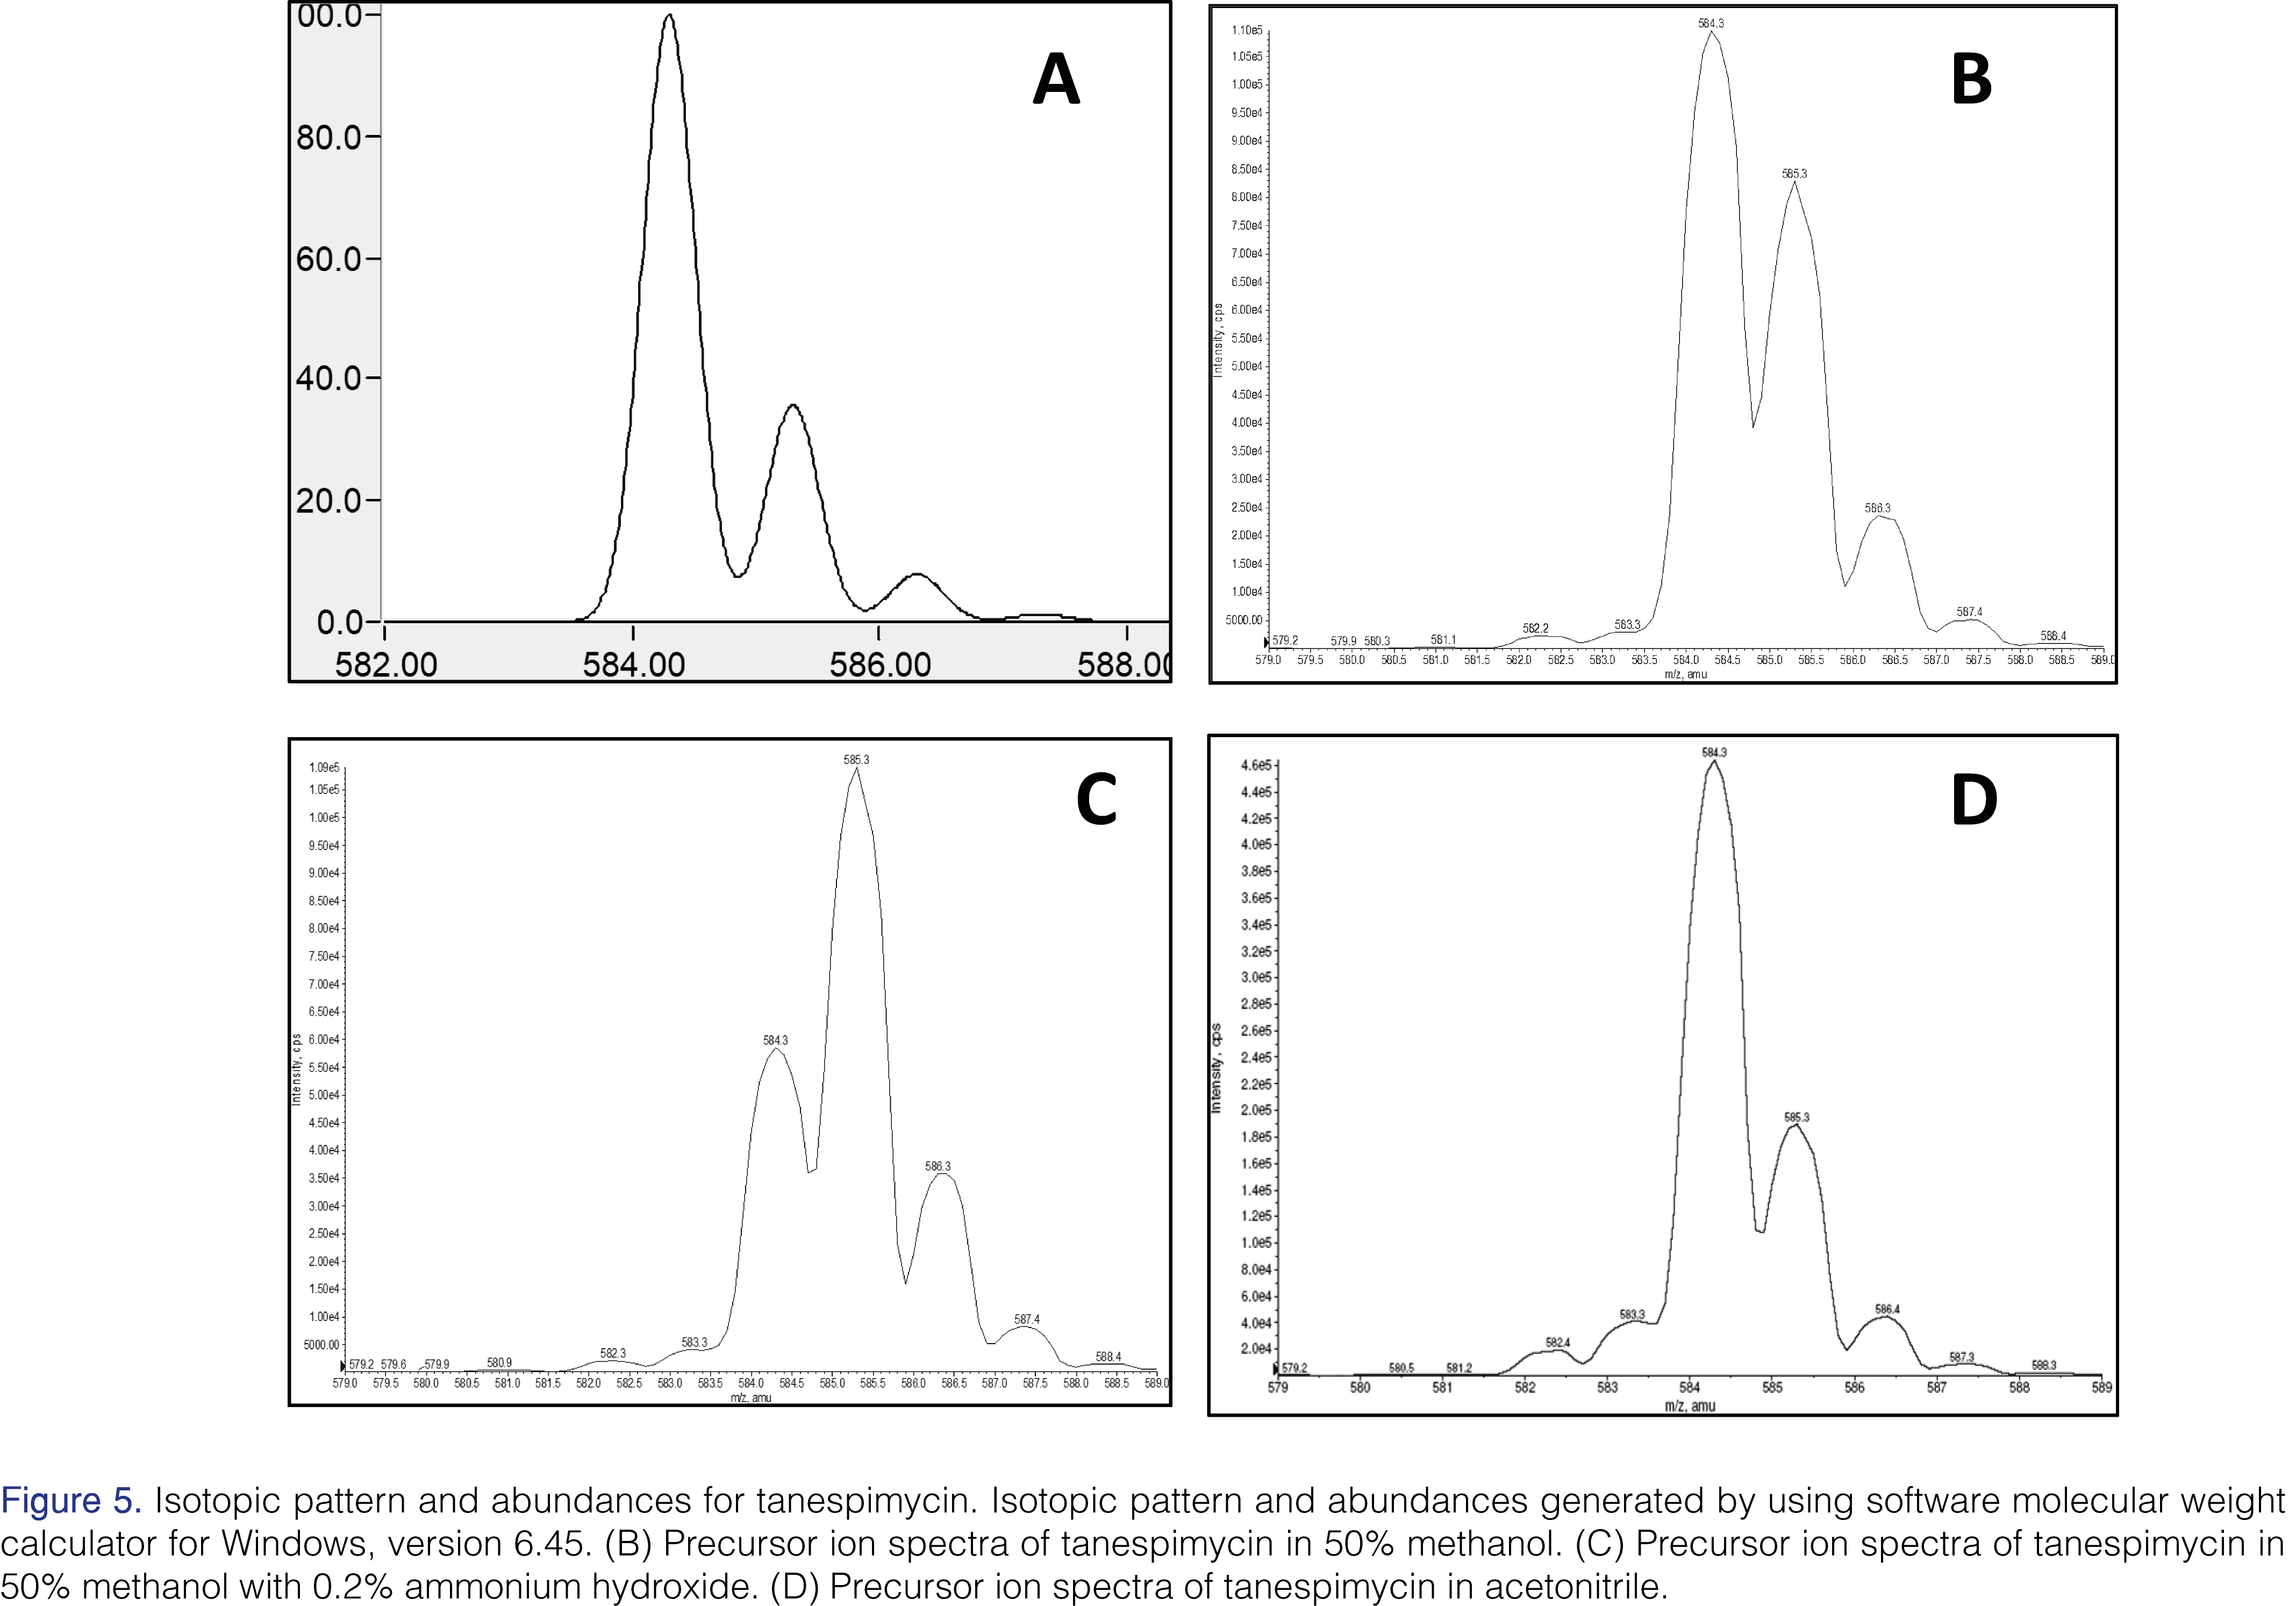
While tuning the mass spectrometer for tanespimycin and the internal standard in a 50% methanol solution, it was noted that the isotope pattern and abundance were different from theoretical expectations (see Figure 5). The predicted 13C isotopic abundance (m/z 585.3) should be approximately 36% of the abundance for the 12C species (m/z 584.3); however, it is closer to 75%. The hypothesis is that ~40% of the peak at m/z 585.3 is due to the formation of semiquinone in the source.
Using a tuning solution prepared in 0.2% ammonium hydroxide and 50% methanol, the isotopic pattern and abundance was shifted even further, with the apparent 13C isotopic abundance (m/z 585.3) being twice the 12C abundance (m/z 584.3). This is illustrated in Figure 5. Based on these spectra obtained during tuning, it was discovered that the analytes were not stable in basic conditions and that the presence of a protic solvent, such as methanol, greatly enhanced the extent of the reduction of analytes in the APCI source. Since radical formation can be promoted using protic solvents such as water or methanol, the hypothesis is that the hydrogen atoms in the protic solvents can react with aromatic carbonyl structures (i.e. quinone) to form hydrogen radicals while undergoing the reduction reaction in the source [18,19,21] to semiquinone and/or hydroquinone.
Addressing the In-source Reduction Reaction
Use of Aprotic Mobile Phase System
To ensure the stability of tanespimycin, 17-AG, and the internal standard in the source, it was necessary to design an appropriate and compatible solvent system. Since the presence of protic solvent in the source provided an environment favorable for a reduction reaction, and therefore contributed to the instability of the analytes, it was important to try to eliminate these types of solvents. The precursor ion scan of tanespimycin in acetonitrile, an aprotic solvent, showed an isotopic abundance spectrum similar to the computer-generated spectra (See Figure 5). Acetonitrile was used in mobile phases and post column infusion of make-up mobile phase (0.1% acetic acid in acetonitrile) to reduce the concentration of protic solvent, such as methanol, from entering the source at any given time during analysis.
APCI Source Temperature
Although the best sensitivity during tuning was achieved using a source temperature setting of 350°C, the temperature of the source used in the validation was 425°C to help keep the source clean. It is hypothesized that the cooler APCI nebulizer probe temperature may allow the analytes to linger longer on the inner surfaces of the probe, hence facilitating the reduction reaction [21]. The temperature setting of 425°C kept the source components cleaner than a setting of 350°C throughout the run. Specific methods used to clean the APCI source are addressed later in the paper.
APCI Source Maintenance
Cleaning the APCI source proved to be critical for the quantitation of 17-AG in the validation. It has been reported in the literature that the cleanliness of APCI source components can affect the extent of reduction reaction for the susceptible aromatic nitro compounds [20], [21]. It was necessary to clean the APCI source during the validation after each run. To ensure more reproducible results, especially for tracking 17-AG with the analog internal standard, it was necessary to heat the APCI source probe [21] in-between each run (700 °C for ~20 minutes). After each run, a fine, black dust deposited on the end of the APCI corona discharge needle, the inside the source housing for the APCI probe, and on the end of the probe itself. If the APCI needle was dirty, it was replaced. The outside of the APCI probe needle holder was also very carefully cleaned and replaced if the needle was damaged or bent.
The inside of the cylindrical portion of the source, where the APCI probe is inserted during injections, was examined for black debris as well. This inner ceramic heater, located in the center of the source, was swabbed with a wooden stick whose cotton-tip was soaked in methanol. It was swabbed several times until no debris was seen when holding the source up to the light and the cotton tip no longer showed black dirt. After cleaning the inner cylinder of the source with methanol, it was dried under house nitrogen to remove any tiny cotton swab particles or other debris that may have been present after cleaning. If sensitivity was still lower than expected after cleaning the source, general system maintenance was performed on the mass spectrometer (i.e. cleaning the source plate or orifice of the MS).
Whether or not the position of the APCI needle is in the center of the source plate is also a factor that can hinder or improve the sensitivity of the analytes. Due to the reduction of tanespimycin and the internal standard, a portion of those two compounds are lost in the APCI source. With the higher concentration of tanespimycin present in the ULOQ standards, the loss of the internal standard would be much less than in the LLOQ standards and cause higher internal standard responses in the ULOQ standards. However, in the ULOQ standard that contained only 17-AG, the internal standard response is similar to the internal standard response in LLOQ standard. This is caused by 17-AG eluting at a different retention time than the internal standard, and therefore, undergoing potentially different source interactions. These possible discrepancies of the internal standard response could contribute to erroneous quantitation of 17-AG, as has been discussed. To help ensure that sensitivity for the analytes was optimal and that responses were consistent from injection to injection, it was important to position the APCI needle so that it was in the center of the source plate during the validation.
Selection of an Appropriate Internal Standard Concentration
During the development of the assay, as mentioned earlier in the paper, quantitation of 17-AG proved to be difficult. As the concentration of tanespimycin increased, so did the internal standard response, leading to quantitation inconsistencies for 17-AG. The internal standard used in those experiments was 150 ng/mL in plasma. Using a significantly higher concentration of the internal standard, i.e. 2500 ng/mL, the response of the internal standard was found to be consistent (Figures 3B and 4B). In this experiment, the quantitation of 17-AG was acceptable (Table 1). Due to the high concentration of the internal standard, any losses due to the in-source reduction were comparatively insignificant and hence internal standard response variability was negated. In the final method, the in-plasma concentration was 1000 ng/mL.
Optimization of Injection Volume and Sample Loop Size
Experiments to optimize injection volume and sample loop size were evaluated. In the first experiment, two sets of conditions were examined. One set of conditions was to inject a 30 µL sample volume onto a 50 µL loop. The second set of conditions involved injecting a 60 µL sample volume onto a 50 µL sample loop. The samples injected with both sets of conditions contained the internal standard at 150 ng/mL in plasma. The QC 7, QC 8, and QC 11 samples, at the same composition and concentrations above, showed a large bias in QC 8 and QC 11 samples for the 30 µL samples injected onto the 50 µL loop (Table 2). For the 60 µL sample volume of QC 8 and QC 11 samples that were injected on the 50 µL loop, the results showed a decrease in the bias for the quantitation of 17-AG (Table 2). The theory is that the larger injection volume may translate to a higher mass of analyte and internal standard on the column and in the APCI source, hence reducing the effect of the variability of internal standard response in the quantitation of 17-AG. With a larger internal standard mass on the column and in the source, if some of the internal standard were lost in the source during the reduction reaction, there would still be sufficient internal standard left after that reaction to be detected by the mass spectrometer and consistently provide accurate quantitation for 17-AG.
An additional experiment was conducted using the same injection volumes and sample loop size as were used above, as well as the same concentrations and compositions of QC’s 7, 8, and 11, except that the concentration of the internal standard was changed from 150 ng/mL to 2500 ng/mL. The results of the QC samples injected with the 30 µL sample volume showed an acceptable percent difference from theoretical; however, with those same samples injected using a 60 µL injection volume on the same 50 µL loop, the percent differences from theoretical concentrations were even smaller for QCs 7 and 8 (Table 2). The combination of increasing the injection volume to 60 µL while using a 50 µL sample loop and increasing the concentration of internal standard in the final extracts made it possible to accurately quantitate 17-AG using tanespimycin-13C3,15N as the analog internal standard. In the validation, the internal standard in plasma concentration used was 1000 ng/mL (A 25 µL of 4000 ng/mL working IS solution was spiked into 100 µL samples) as 2500 ng/mL was at the ULOQ for tanespimycin and above the ULOQ for 17-AG).
Assay Validation Summary
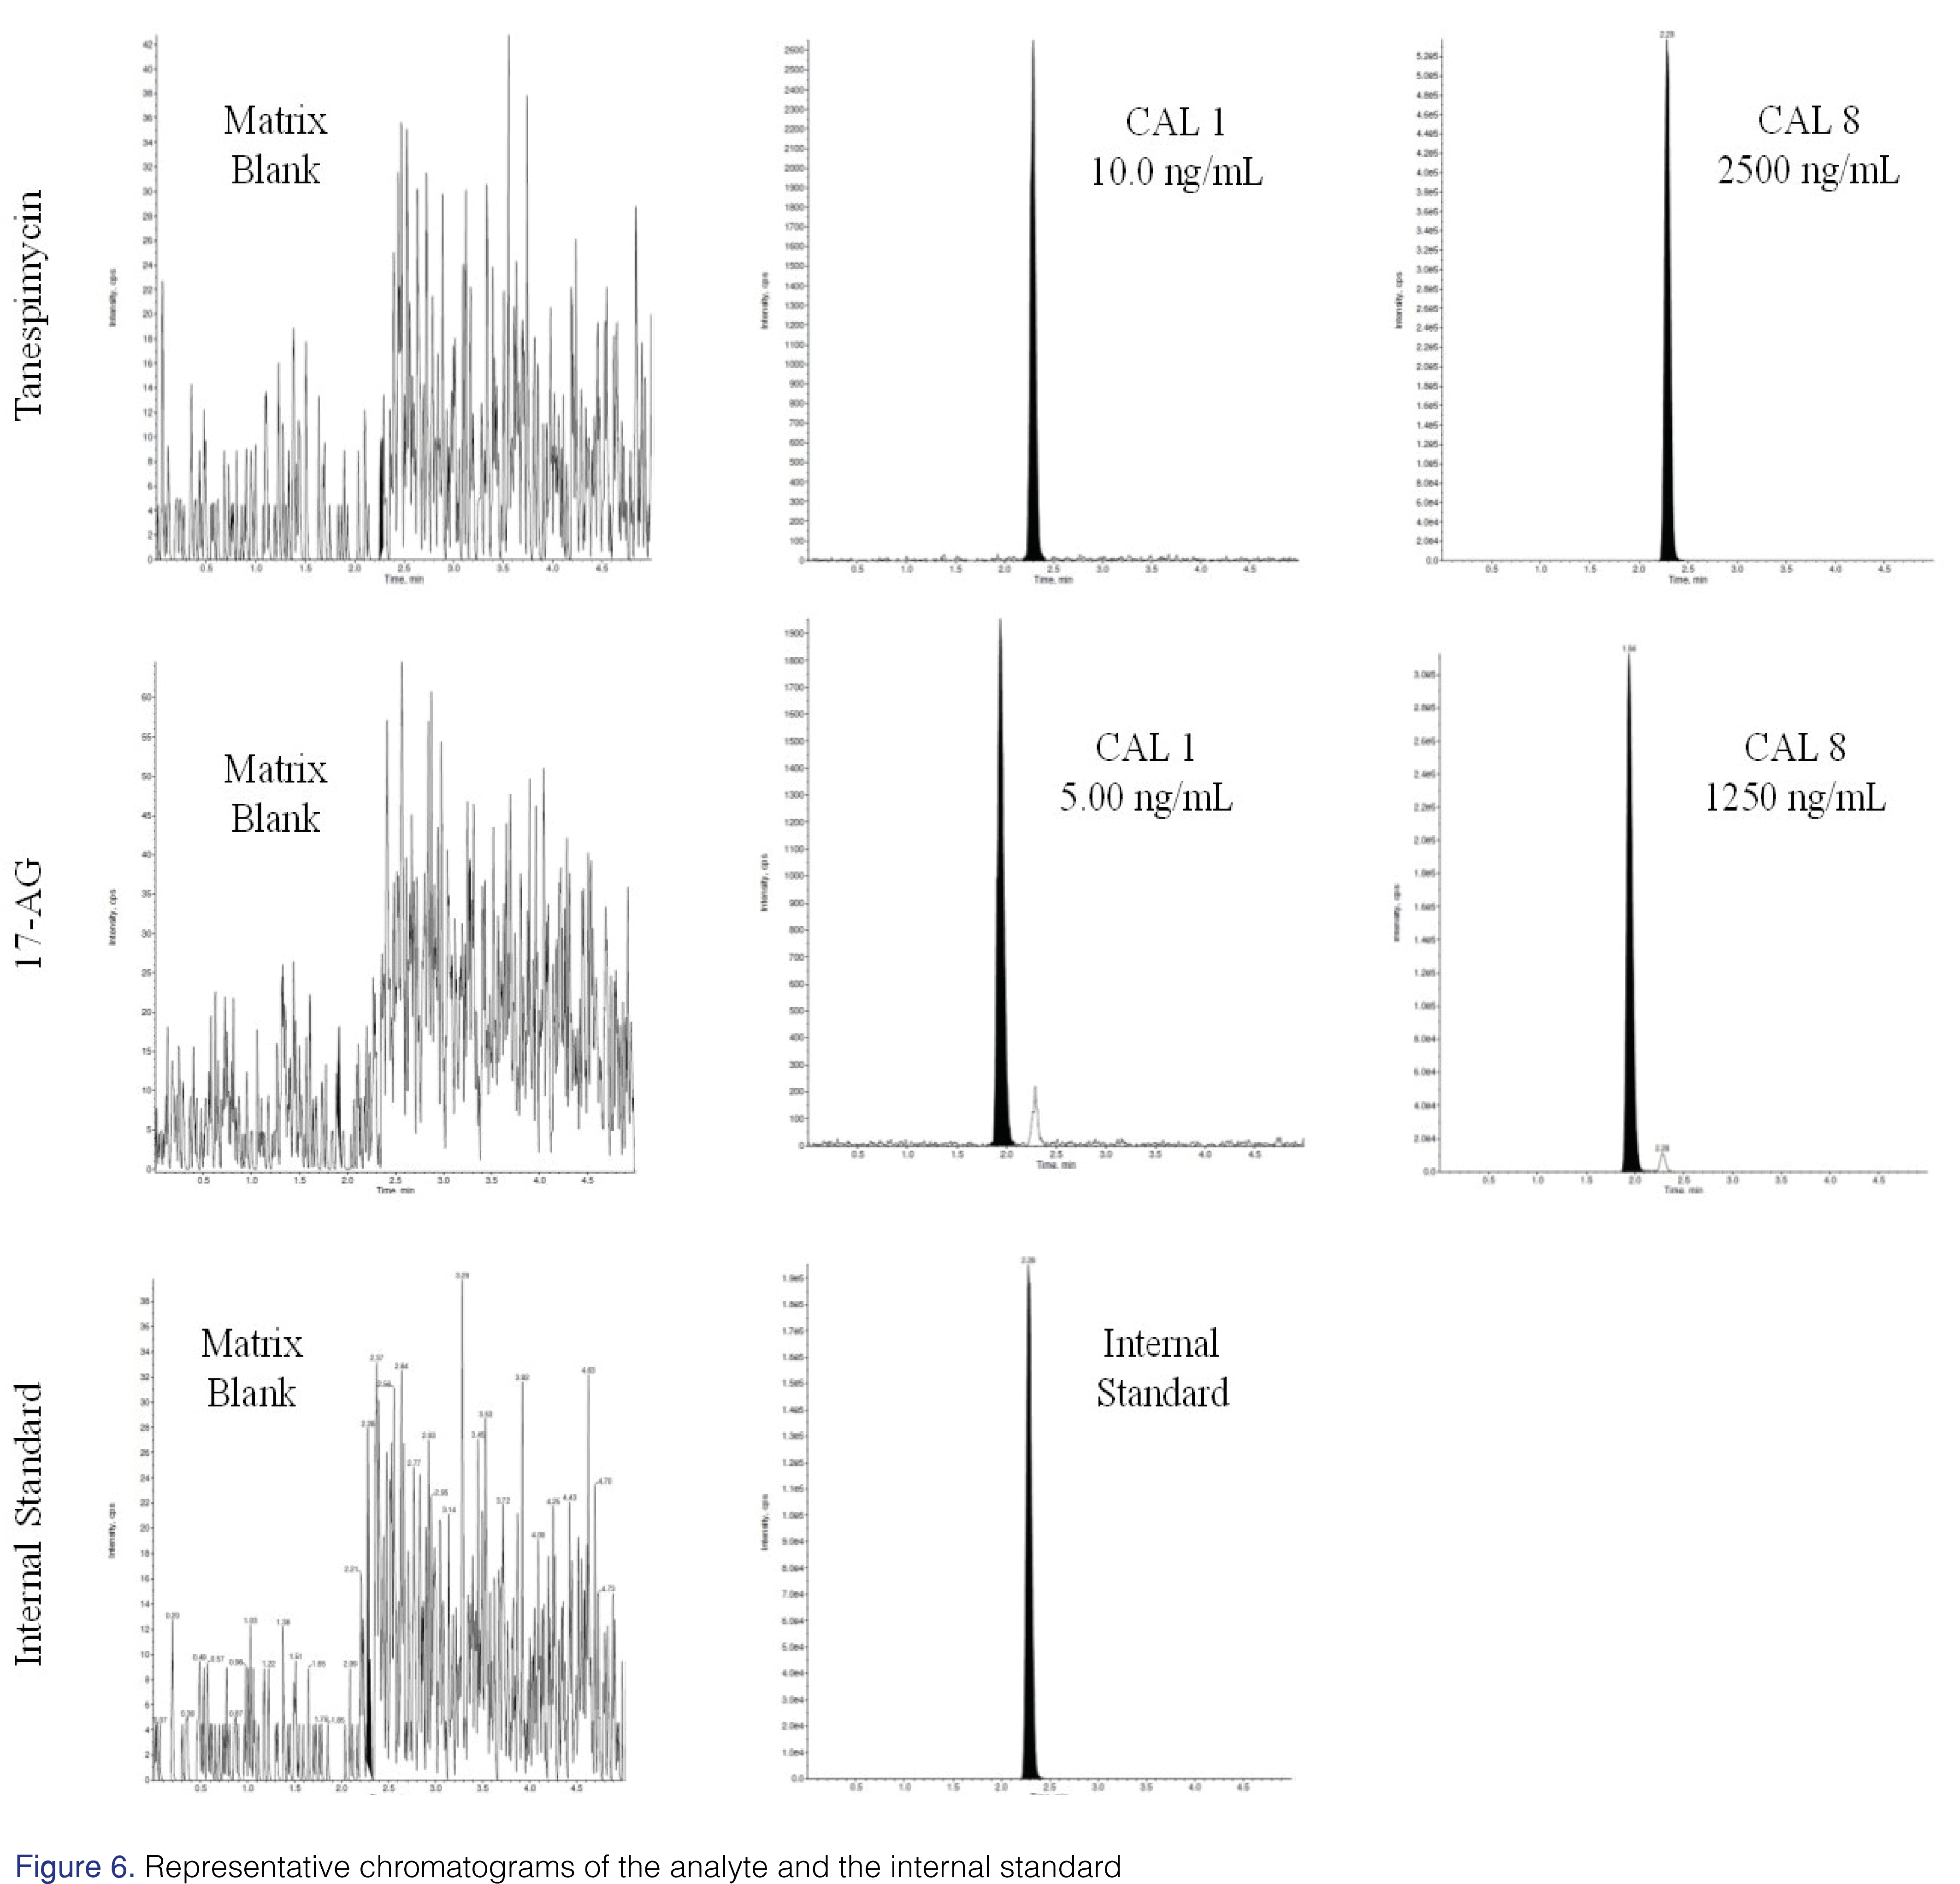
To ensure the method was robust, it was fully validated using the optimized conditions and the precautionary source-maintenance steps. The method was linear over the concertation range of 10.0 to 2500 ng/mL and 5.0 to 1250 ng/mL for tanespimycin and 17-AG, respectively. A linear, 1/concentration2 -weighted, least-squares regression algorithm was used to plot the peak area ratio of the appropriate analyte to its internal standard versus concentration. Intra-assay and inter-assay precision and accuracy results are summarized in Table 3. The representative chromatograms of both analyte and internal standard are shown in Figure 6.
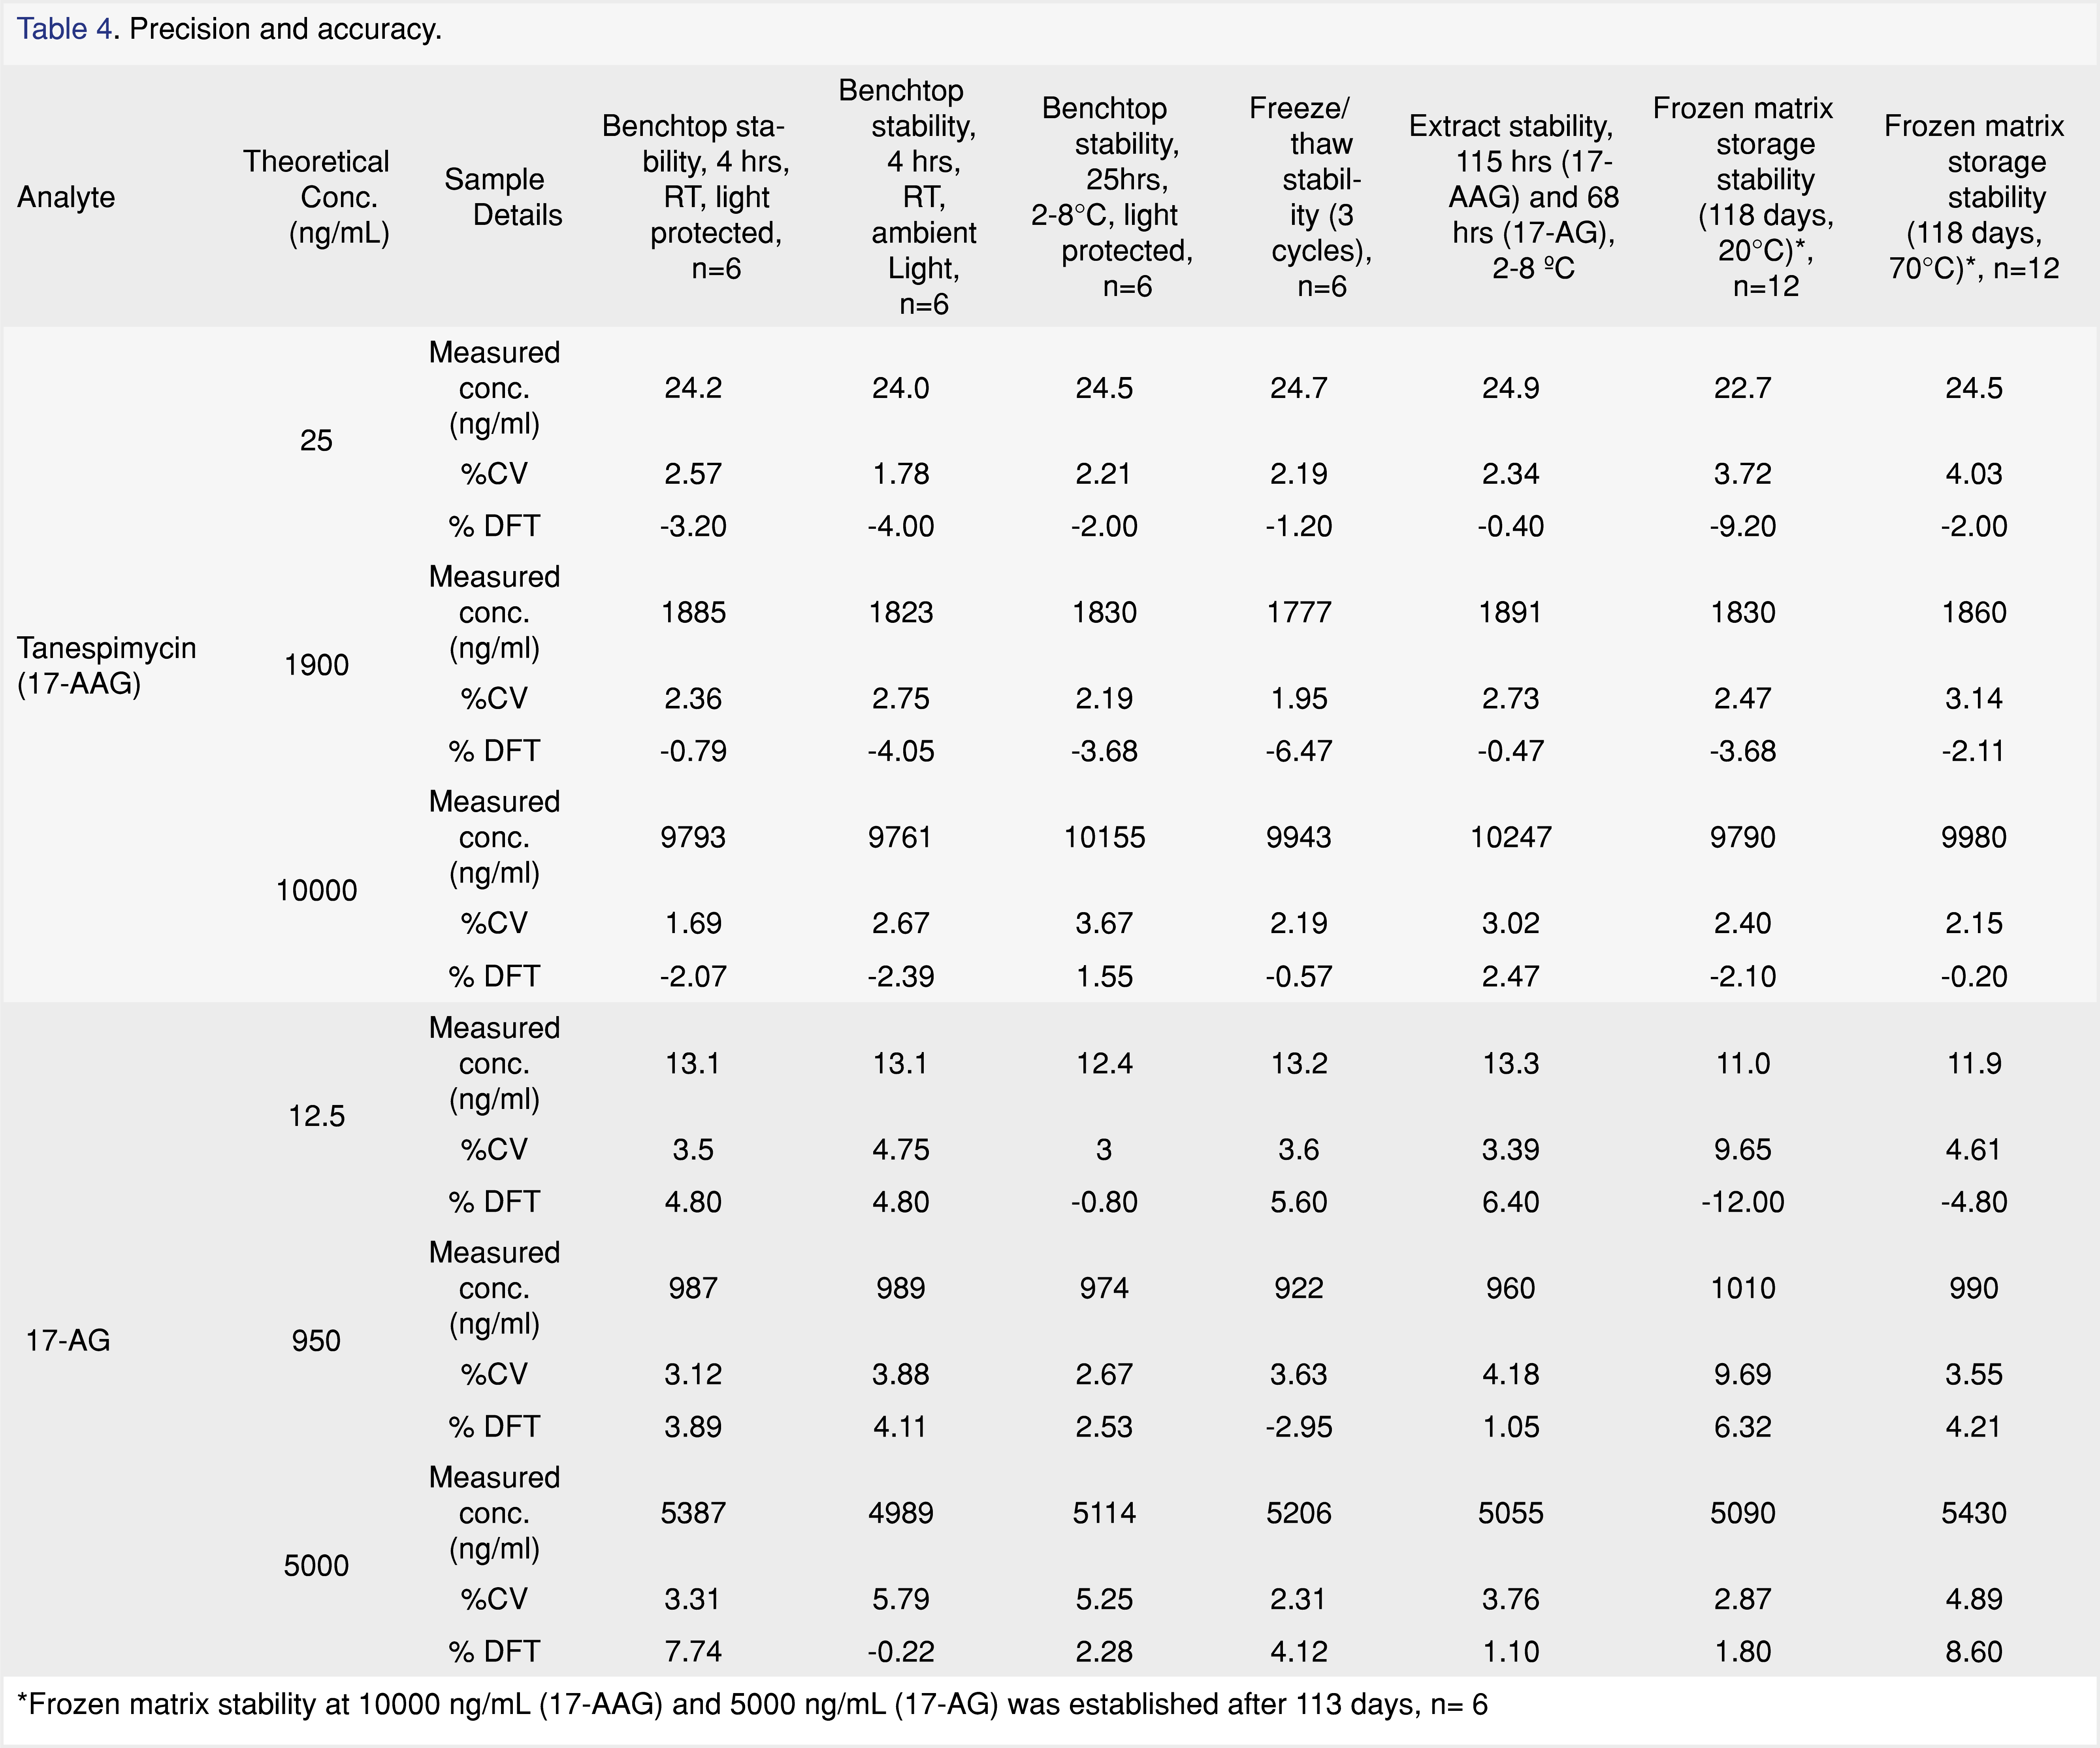
No significant interferences due to background matrix contributions were detected for tanespimycin, 17-AG, or the internal standard at their expected retention times and designated mass transitions in the twelve individual lots examined during selectivity assessment. Fortified specificity samples in the twelve individual lots were within acceptance criteria for both analytes. Analyte interference check showed that tanespimycin at ULOQ concentrations contributed to 17-AG at 193% of the LLOQ for 17-AG. This corresponds to a less than 0.5% bias in each calibration standard for 17-AG. The reason for this contribution can be attributed to an impurity in the tanespimycin reference standard material, as confirmed by equivalent concentration, “neat”, external analyte interference samples that were injected at the same time as the analyte interference samples. Non-interference testing with bortezomib did not show any notable interference.Stability studies are summarized in Table 4. The bench top stability for both analytes in human plasma containing sodium heparin was acceptable after 4 hours of storage at room temperature under ambient and protected light conditions. Additionally, bench top stability for both analytes was acceptable after 25 hours of storage at 2 to 8°C under protected light conditions. Tanespimycin and 17-AG in human plasma containing sodium heparin had acceptable stability after three freeze (-20°C/thaw at room temperature under reduced light) cycles. The long-term storage stability of tanespimycin in human plasma containing sodium heparin was established for a total of 118 days at -20°C and at -70 °C for both tanespimycin and 17-AG. The stability of the processed samples was found to be acceptable for 115 hours and 68 hours when stored at 2 to 8°C for tanespimycin and 17-AG, respectively and quantitated against a freshly prepared standard calibration curve. The reinjection integrity was assessed for 107 hours at 2 to 8°C after original sample analysis using QC samples for both analytes. The reinjected QC samples were quantitated against the reinjected standard curves.
Whole blood stability results indicated that tanespimycin is stable for both storage conditions, i.e. room temperature and on ice, and at both low and high concentrations for up to two hours. However, 17-AG was not stable at room temperature at the low level after one or two hours. Due to the unacceptable stability results of 17-AG for more than one hour at either room temperature or on ice, the whole blood stability experiment was repeated to evaluate 0.5 hour and was found to be acceptable. Although the data would suggest that there is a temperature instability for 17-AG, data (not shown) gathered during development experiments indicated that the low bias at room temperature could be due to a red blood cell partitioning effect.
The extraction efficiency (reported as a percentage) and matrix effect (reported as a ratio) for tanespimycin, 17-AG, and the internal standard in human plasma were evaluated. The recovery for tanespimycin was 109.0% and 108.5% at the low, mid and high levels, respectively. The recovery of 17-AG was 113.7 and 113.8% at the low, mid and high levels, respectively. The internal standard recovery at its level of use in the extraction, using tanespimycin as the reference compound at 25.0 ng/mL and 1900 ng/mL, was 114.7% and 124.3%, respectively. The matrix effect for tanespimycin at the low and high levels was 0.73 and 0.83, respectively. The matrix effect for 17-AG at the low and high levels was 1.15 and 1.24, respectively. The matrix effect for the internal standard at the level of use tested, using tanespimycin as the reference compound at 25.0 ng/mL and 1900 ng/mL, was 0.76 and 0.83, respectively.
The bioanalytical method was developed validated to support a clinical program. However, no patient samples were analyzed as the clinical study was prematurely terminated. Hence, the clinical utility of the method was not demonstrated with patient samples. The focus of this paper is to report the observation of in-source reduction during APCI ionization of drugs with a quinone moiety and demonstrating possible solutions to address this problem.
Conclusion
A robust LC-MS/MS method for the quantitative determination of tanespimycin and 17-AG in human sodium heparin plasma was developed and validated for use in clinical studies. The quantitation of tanespimycin and 17-AG with the use of tanespimycin –13C3,15N as the labeled internal standard for tanespimycin and as the analog internal standard for 17-AG presented several challenges that were overcome during method development and validation. Tanespimycin, 17-AG, and tanespimycin-13C3,15N contain a 1,4 benzoquinone, which is susceptible to undergo reduction to form seminquinone or hydroquinone. During method development, an increase in the internal standard response was observed with an increase in tanespimycin concentrations. The internal standard variability was attributed to the in-source reduction during APCI ionization. Several steps were undertaken to minimize the in-source reduction. Protic solvents enhance in-source reduction, hence the instrument method was modified to utilize an aprotic mobile phase system. Using a third pump, acetonitrile was added to the eluate post-column to increase the proportion of aprotic solvent entering the ion source. Higher source temperature and continuous maintenance of the source in-between runs was incorporated in the method protocol to maintain a cleaner source. In the original method, tanespimycin was undergoing preferential in-source reduction at a higher concentration. This anomaly was rectified by using a higher internal standard in-plasma concentration coupled with a higher injection volume. Numerous pharmaceutical drugs have quinone moiety which might undergo similar in-source reduction during APCI ionization. The methodology employed in this manuscript can find applications in the bioanalytical method development of these drugs.
Acknowledgements
The authors wish to acknowledge Bruce Hidy from PPD, for determining the isotopic pattern and abundances for tanespimycin using software Molecular Weight Calculator for Windows, version 6.45. The authors also thank Diane Lebarbenchon for her grammatical edits and formatting of the manuscript.
References
- Dymock BW, Drysdale MJ, McDonald E, Workman P. Inhibitors of HSP90 and other chaperones for the treatment of cancer. Expert Opin Ther Pat 14(6),837-847 (2004).
https://doi.org/10.1517/13543776.14.6.837 - Whitesell L, Mimnaugh EG, De Costa B, Myers CE, Neckers LM. Inhibition of heat shock protein HSP90-pp60v-src heteroprotein complex formation by benzoquinone ansamycins: essential role for stress proteins in oncogenic transformation. Proc Natl.Acad Sci 91(18), 8324-8328 (2006).
https://doi.org/10.1073/pnas.91.18.8324 - Supko JG, Hickman RL, Grever MR, Malspeis L. Preclinical pharmacologic evaluation of geldanamycin as an antitumor agent. Cancer Chemother Pharmacol 36 (4), 305-315 (1995).
https://doi.org/10.1007/BF00689048 - Deboer C, Peterson DH. Against Tetrahyniena pyriformis. Cancer, 442-447 (1970).
https://doi.org/10.7164/antibiotics.23.442 - Grem JL et al. Phase I and pharmacologic study of 17-(allylamino)-17-demethoxygeldanamycin in adult patients with solid tumors. J Clin Oncol 23(9), 1885-1893 (2005).
https://doi.org/10.1200/JCO.2005.12.085 - Johnston JS et al. Development and validation of a rapid and sensitive high-performance liquid chromatography-mass spectroscopy assay for determination of 17-(allylamino)-17-demethoxygeldanamycin and 17-(amino)-17-demethoxygeldanamycin in human plasma. J Chromatogr B Anal Technol Biomed Life Sci. 871(1), 15-21 (2008).
https://doi.org/10.1016/j.jchromb.2008.06.029 - Egorin MJ, Rosen DM, Wolff JH, Callery PS, Musser SM, Eiseman JL. Metabolism of 17-(allylamino)-17-demethoxygeldanamycin (NSC 330507) by murine and human hepatic preparations. Cancer Res 58(11), 2385-2396 (1998).
- Schulte TW, Neckers LM. The benzoquinone ansamycin 17-allylamino-17-demethoxygeldanamycin binds to HSP90 and shares important biologic activities with geldanamycin. Cancer Chemother Pharmacol 42(4), 273-279 (1998).
https://doi.org/10.1007/s002800050817 - Burger AM. Highlights in experimental therapeutics. Cancer Lett 245(1-2), 11-21 (2007).
https://doi.org/10.1016/j.canlet.2006.03.012
- Kamal SA, et al. A high-affinity conformation of Hsp90 confers tumour selectivity on Hsp90 inhibitors. Nature 425(6956),407-410 (2003).
https://doi.org/10.1038/nature01913 - Jemal M, Xia Y-Q. LC-MS Development Strategies for Quantitative Bioanalysis. Curr Drug Metab 7(5), 491-502 (2006).
https://doi.org/10.2174/138920006777697927 - Hwang K, Scripture CD, Gutierrez M, Kummar S, Figg WD, Sparreboom A. Determination of the heat shock protein 90 inhibitor 17- dimethylaminoethylamino-17-demethoxygeldanamycin in plasma by liquid chromatography-electrospray mass spectrometry. J Chromatogr B Anal Technol Biomed Life Sci 830(1), 35-40, (2006).
https://doi.org/10.1016/j.jchromb.2005.10.019 - Chen X, Gardner ER, Gutierrez M, Kummar S, Figg WD. Determination of 17-dimethylaminoethylamino-17-demethoxygeldanamycin in human plasma by liquid chromatography with mass-spectrometric detection. J Chromatogr B Anal Technol Biomed Life Sci 858(1-2), 302-306 (2007).
https://doi.org/10.1016/j.jchromb.2007.08.022 - Vallano PT, Shugarts SB, Woolf EJ, Matuszewski BK. Elimination of autosampler carryover in a bioanalytical HPLC-MS/MS method: A case study. J Pharm Biomed Ana 36(5), 1073-1078 (2005).
https://doi.org/10.1016/j.jpba.2004.09.010 - Guidance for Industry Bioanalytical Method Validation Guidance for Industry Bioanalytical Method Validation. USFDA, May, pp. 1-22, 2001. Available at https://www.fda.gov/media/70858/download
- Souverain S, Rudaz S, Veuthey JL. Matrix effect in LC-ESI-MS and LC-APCI-MS with off-line and on-line extraction procedures. J Chromatogr A 1058(1-2),61-66 (2004).
https://doi.org/10.1016/S0021-9673(04)01477-3 - Karancsi T, Slegel P. Reliable molecular mass determination of aromatic nitro compounds: Elimination of gas-phase reduction occurring during atmospheric pressure chemical ionization [1]. J Mass Spectrom 34(9), 975-977 (1999).
https://doi.org/10.1039/C7RA08523K - Elkin YN, Zadorozhny PA, Koltsova EA, Pshenichnyuk SA, Vorob’Ev AS, Asfandiarov NL. Negative ion mass spectra of hydrophilic naphtoquinones. J Anal Chem 68(13), 1162-1164 (2013).
https://doi.org/10.1134/S1061934813130042 - Budzikiewicz H. Reactions between substrate molecules and chemical ionization reagent gases prior to ionization. Org Mass Spectrom 23(8), 561-565 (1988).
https://doi.org/10.1002/oms.1210230802 - Kertesz V, Van Berkel GJ. Surface-assisted reduction of aniline oligomers, N-phenyl-1,4-phenylenediimine and thionin in atmospheric pressure chemical ionization and atmospheric pressure photoionization. J Am Soc Mass Spectrom 13(2), 109-117 (2002).
https://doi.org/10.1016/S1044-0305(01)00337-3 - McEwen CN. Radicals in analytical mass spectrometry. Mass Spectrom Rev 5(4), 521-547 (1986).
https://doi.org/10.1002/mas.1280050405
All site content, except where otherwise noted, is licensed under a Creative Commons Attribution 4.0 License
