OPEN-ACCESS PEER-REVIEWED
RESEARCH ARTICLE
Ganesh S. Moorthy1,*, Paul A. Stricker2, Athena F. Zuppa1,2
1The Children’s Hospital of Philadelphia, Center for Clinical Pharmacology, Philadelphia, PA, USA. 2Department of Anesthesiology and Critical Care, The Children’s Hospital of Philadelphia, Philadelphia, PA, USA.
Journal of Applied Bioanalysis. Vol.1. No.3. pages 99-107 (2015)
Published 15 July 2015. https://doi.org/10.17145/jab.15.016 | (ISSN 2405-710X)
*Correspondence: Moorthy GS . Center for Clinical Pharmacology, The Children’s Hospital of Philadelphia, 3501 Civic Center Blvd, CTRB 4014, Philadelphia, PA 19104
Phone: +1 2155900142, Fax:+1 2154250114
Citation:
Moorthy GS, Stricker PA, Zuppa AF. A simple and selective liquid chromatography-tandem mass spectrometry method for determination of epsilon-aminocaproic acid in human plasma. J Appl Bioanal 1(3), 99-107 (2015).
Open-access and Copyright:
©2015 Moorthy GS et al. This article is an open access article distributed under the terms of the Creative Commons Attribution License (CC-BY) which permits any use, distribution, and reproduction in any medium, provided the original author(s) and source are credited.
Funding/Manuscript writing assistance:
This work was supported in part by the Thomas B. McCabe and Jeannette E. Laws McCabe Fund. The authors declare that no writing assistance was utilized in the production of this article.
Competing interest:
The authors have declared that no competing interest exist.
Article history:
Received: 11 January 2015, Revised 18 June 2015, Accepted 21 June 2015
Abstract
Understanding the clinical pharmacology of the antifibrinolytic drug epsilon-aminocaproic acid (EACA) is critical for rational drug administration in children. The aim of this study is to develop a reliable assay for the determination of EACA in human plasma. We describe a high-performance liquid chromatography-tandem mass spectrometry (HPLC-MS/MS) assay for EACA in human plasma. Sample preparation involved plasma dilution (1:2040), followed by reversed-phase chromatographic separation and selective detection using tandem mass spectrometry. EACA had a linear range of 1 – 250 µg/mL. The intraday precision based on the standard deviation of replicates of quality control samples ranged from 4.7 to 10.4% and the accuracy ranged from 92-106%. The interday precision ranged from 4.6 to 9.8% and the accuracy ranged from 95-103%. Stability studies showed that EACA was stable during the conditions for sample preparation and storage. The described method is robust and successfully employed for clinical studies of EACA in children.
Keywords
EACA, amicar, LC-MS/MS, plasma.
Introduction
Intraoperative hemorrhage during pediatric craniofacial reconstruction and other surgical procedures can be significant and may exceed the circulating blood volume [1] mandating substantial perioperative transfusion. The intraoperative administration of antifibrinolytic agents is increasingly used to minimize blood loss and the need for transfusion [2]. Fibrin binding by tissue-type plasminogen activator and plasminogen is the key to the initiation of fibrinolysis. Plasmin is generated and cleaves fibrin, producing new C-terminal lysines, which serve to mediate positive feedback in the fibrinolytic cascade [3]. Downregulation of fibrinolysis in vivo occur through the action of carboxypeptidases, which remove C-terminal lysines [4]. The antifibrinolytic epsilon-aminocaproic acid (EACA) is a synthetic lysine analogue that blocks the lysine-binding sites on plasminogen, resulting in antifibrinolytic activity through inhibition of plasmin formation [5, 6] and ultimately clot stabiliziation. The objective of this investigation was to develop and validate a simple and selective liquid chromatography tandem mass spectrometry (LC-MS/MS) method for the quantification of EACA in human plasma to support clinical pharmacokinetic studies of EACA in pediatric patients. There were several HPLC methods reported in the literature for analysis of EACA in biological samples. EACA was dansylated and measured by fluorescence detection [7] with an assay range of 50 to 1000 µg/mL in human serum. A similar HPLC-fluorimeter assay with a range of 62.5 to 1000 µg/mL was reported by Lacroix C et.al. [8]. An assay for EACA in plasma and urine after derivatization with o-phthalaldehyde and fluorescence detection was reported with an assay range of 50 to 250 µg/mL [9]. One of the common challenges encountered with HPLC methods were separation of EACA from other naturally occurring amino acids in biological samples. Recently, a method was reported for analysis of EACA in ophthalmic formulation that utilized isocratic tandem-mode HPLC with reverse phase and strong cation exchange columns and an assay range of 500–1500 µg/mL [10]. Previously, a LC-MS/MS assay was reported for analysis of caprolactam and EACA in human urine [11]. Assay range for EACA was 62.5-1000 ng/mL, when a 20 μL aliquot of urine was injected directly into (LC-MS-MS) system. Recently, two LC-MS/MS assays were reported for analysis of structurally related compound, tranexamic acid in human plasma with an assay range of 0.8-200 µg/mL [12] and 1-200 µg/mL [13]. In the present study, we report a simple and selective LC-MS/MS assay for quantitation of EACA in human plasma in concentration range of 1–250 µg/mL. This assay has been successfully employed for analysis of EACA in pediatric plasma samples [14, 15].
Materials and methods
Reagents and chemicals
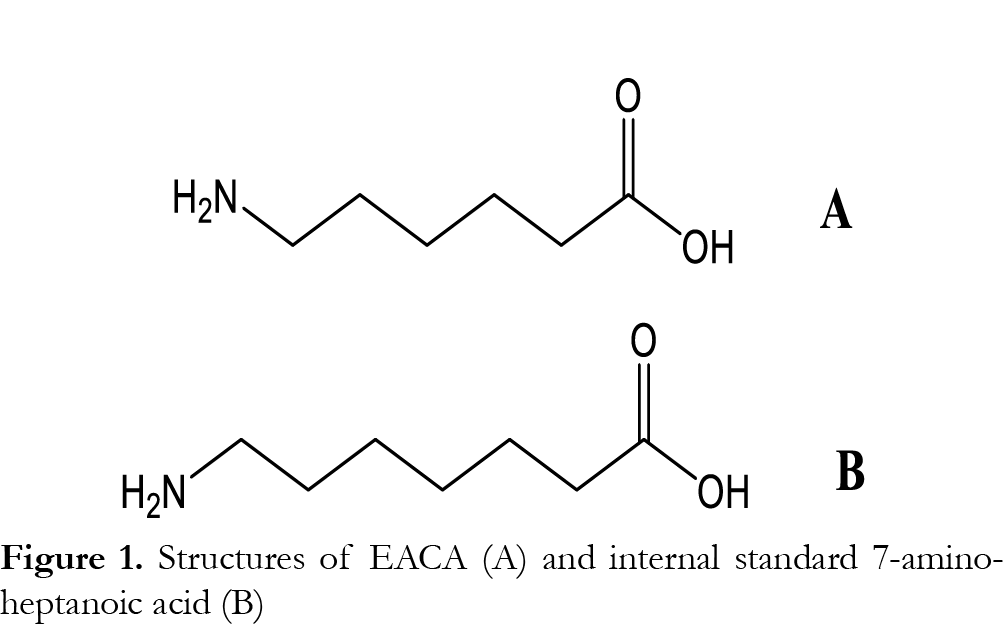
EACA (epsilon-aminocaproic acid) and 7-aminoheptanoic acid were purchased from Sigma-Aldrich (Cambridge, MA, USA) (Fig. 1) . The different lots of drug-free (blank) human plasma (prepared with citrate-phosphate-dextrose, or citrate-phosphate-dextrose-dextrose or citrate-phosphate-dextrose–adenine) were obtained from the blood bank at The Children’s Hospital of Philadelphia. HPLC grade methanol and acetonitrile were purchased from Fisher-Scientific (Pittsburgh, PA, USA) and reagent-grade formic acid (~96%) was purchased from Sigma-Aldrich Co. (St. Louis, MO, USA). Deionized water was prepared using a Barnstead Nanopure™ water purifying system from Thermo Fisher Scientific (Marietta, OH, USA).
Liquid chromatography
The Shimadzu HPLC system consisted of two LC-20AD delivery pumps, a DGU-20A5 Shimadzu vacuum degasser, a SIL-20AC Shimadzu autosampler and a CBM-20A system controller (Shimadzu Scientific Instruments; Columbia, MD, USA). HPLC separations were performed on a Thermo Scientific Nucleosil C18 analytical column (3 x 100 mm, 3.5 µm 120 A). For chromatographic separation, water with 0.1% formic acid was used as mobile phase A and methanol was used as mobile phase B. The linear gradient was as follows: 0.00-0.50 minutes mobile phase A 80%, mobile phase B 20%; 0.51-3.00 minutes mobile phase A 20%, mobile phase B 80% with divert valve off; 3.00-3.51 minutes mobile phase A 80%, mobile phase B 20%; and initial gradient maintained until 6 minutes. The flow rate was 0.50 mL/min and 5 µL of the sample was injected for each analysis. The column and autosampler were maintained at room temperature and 10°C, respectively. An electronic valve actuator with a Rheodyne selector valve was used to divert LC flow to waste, at the first 0.5 minute and the last 3 minutes, when no data acquisition was taking place.
Mass spectrometry analysis
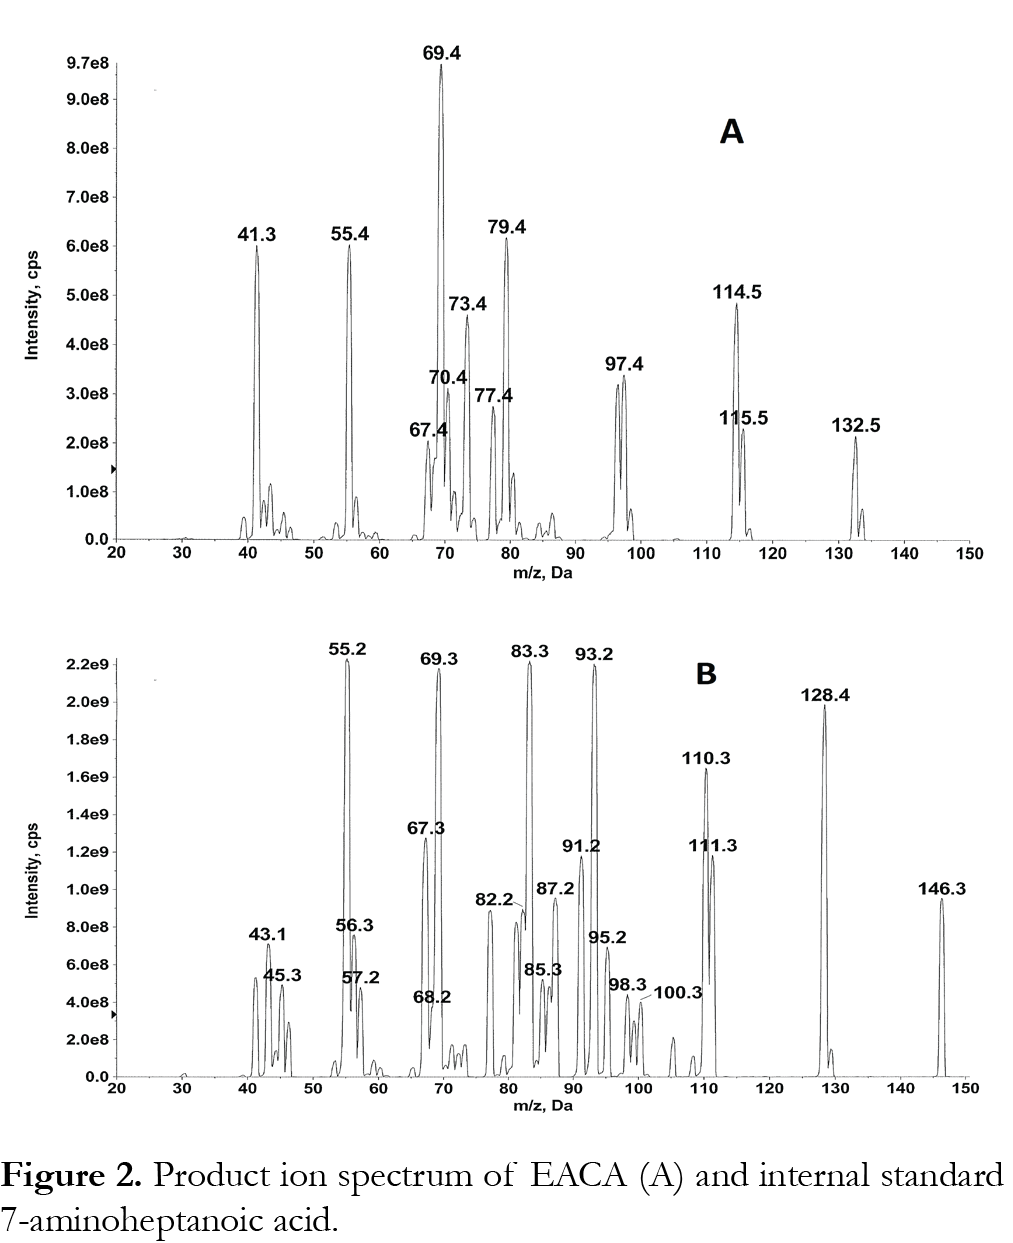
Samples were analyzed with an ABI/Sciex 4000 triple quadropole mass spectrometer equipped with Turbo Ionspray. Software for controlling this equipment, acquiring and processing data was Analyst version 1.6.2 software (MDS Sciex; Toronto, Canada). The positive ion mode for MS/MS analysis was selected. Nitrogen (purity >99.999 %) was used as the nebulizer, auxillary, collision and curtain gases. Analytes were detected by tandem mass spectrometry using multiple reaction monitoring (MRM) with a dwell time of 100 ms. For the determination of the mass of the precursor and product ions a solution of 500 µg/mL EACA or internal standard in mobile phase (1:1 methanol: water (v/v) with 0.05% formic acid) was infused directly into the ion sources with a Harvard Apparatus syringe pump at a flow rate of 10 µL/min. The most intense precursor-to-fragment transitions using positive turbo spray were: EACA m/z 132.20→79.10; 7-aminoheptanoic acid (internal standard) m/z 146.20→55.10. We have used additional MRMs of 132 to 114, 132 to 69 and 132 to 55 to confirm EACA. Product ion spectrum of EACA and 7-aminoheptanoic acid is shown in Fig. 2. The conditions for ionization of EACA and internal standard were optimized using individual standard solutions, each at 500 ng/mL in 1:1 methanol: water (v/v) with 0.05% formic acid at 10 µL/min. EACA and internal standard were infused by a syringe pump alone or through a Tee device at a flow rate of 10 µL/min into the stream of mobile phase (1:1 methanol: water (v/v) with 0.05% formic acid at 0.5 mL/min). eluting from the LC column through a mixing Tee and then into the turbo spray source, to mimic the LC-MS/MS conditions. The main working parameters of the mass spectrometer were: collision activate dissociation (CAD) gas, 8; curtain gas 40; Gas 1 (nebulizer gas) 80; Gas 2 (heater gas) 50; source temperature 600°C. The optimized declustering potential (DP), entrance potential (EP), collision energy (CE), collision cell exit potential (CXP) were set at 46, 10, 23, 6 for EACA; 46, 10, 50, 10 for 7-aminoheptanoic acid (IS).
Preparation of standards and quality control (QC) samples
Two independent EACA stock solutions at 25 mg/mL in water were prepared: standard solutions were prepared from one stock solution and QC samples were prepared from the other. The stock solutions were stored at -20 °C and were stable at least for 1 year. The primary stock solution was diluted in human plasma to prepare intermediate stock solutions of 500 µg/mL. Working solutions of EACA were freshly prepared by appropriately diluting the respective stock solutions with plasma. Eight standards containing EACA concentrations of 1, 2.5, 5, 10, 25, 50, 100 and 250 µg/mL were prepared by adding the appropriate volumes of working solution into 1.5 mL eppendorf tubes containing plasma. Four QC concentrations were prepared in the same manner by adding appropriate volumes of working solution to obtain concentrations of 1, 4, 40 and 200 µg/mL, representing LLOQ, low, medium and high QCs. The internal standard stock solution was prepared by dissolving 4 mg of 7-aminoheptanoic acid in water to a final concentration of 1 mg/mL. Internal standard working solution was prepared by diluting the internal standard stock solution with water into a single working solution with a final concentration of 2 µg/mL. Amber glass vials for storing stock solution were used. Representative pharmacokinetic plasma samples used in this study were collected and processed as described previously [15].
Sample preparation
Blood samples were collected in Microtainer tubes (BD, Franklin Lakes, NJ, USA) containing lithium heparin and stored at 4°C for up to 12 h prior to centrifugation and separation of plasma [14]. To 50 µL of each standard, QC, blank, and unknown plasma samples from clinical studies in 1.5 mL Eppendorf tube, 1 mL of 10% acetic acid in water was added (1:20 dilution). Samples were vortex mixed and 50 µL of the aliquot was transferred into a disposable culture tube. To each tube, internal standard solution (50 µL) and 5 mL of water was added and vortex mixed (1:102 dilution). The sample preparation involves net dilution of 1:2040. An aliquot (300 µL) of the final solution was transferred into the appropriate position of a 96 well MicroLiter® plate for analysis. Five µL of the supernatant was injected into the LC-MS/MS system for analysis.
Method validation
Method validation and documentation were performed according to guidelines set by the United States Food and Drug Administration (FDA) for bioanalytical method validation [16]. This method was validated in terms of linearity, specificity, lower limit of quantitation (LLOQ), recovery, intra- and inter-day accuracy and precision, and stability of the analyte during sample storage and processing procedures [17]. Each analytical run included a double blank sample (without internal standard), a blank sample (with internal standard), eight standard concentrations for calibration, and six sets of QC samples: LLOQ QC at 1 µg/mL, low QC at 4 µg/mL, medium QC at 40 µg/mL, and high QC at 200 µg/mL.
Linearity and sensitivity
For the evaluation of the linearity of the standard calibration curve, the analyses of EACA in plasma samples were performed on three independent days using fresh preparations. The calibrations curves were prepared over a linear range of 1-250 µg/mL at eight concentrations of 1, 2.5, 5, 10, 50, 25, 50, 100, and 250 µg/mL. Each calibration curves consisted of a double blank sample, a blank sample, a plasma blank sample and eight calibrator concentrations. Another double blank sample was analyzed immediately following the highest concentration standard in each run to monitor for carryover of EACA or the internal standard. The calibration curve was developed using the following criteria: (1) the mean value should be within ±15% of the theoretical value, except at the LLOQ, where it should not deviate by more than ±20%; (2) the precision around the mean value should not exceed a 15% coefficient of variation (CV), except for LLOQ, where it should not exceed a 20% CV. (3) at least 75% of the eight non-zero standards of each nominal concentration should meet the above criteria; (4) the linear correlation coefficient (r, Pearson product moment correlation coefficient) should be greater than or equal to 0.98. Each calibration curve was constructed by plotting the EACA to internal standard peak area ratio (y) against the EACA concentrations (x). The calibration curves were fitted using a least-square linear regression model y=ax+b, weighted by 1/x2 using the Analyst ® software. The resulting a, and b parameters were used to determine back-calculated concentrations, which were then statistically evaluated.
Specificity
The specificity was defined as non-interference at retention times of EACA from the endogenous plasma components and no cross-interference between EACA and internal standard using the proposed extraction procedure and LC-MS/MS conditions. Six different lots of blank (EACA free plasma, prepared with lithium heparin as a anticoagulant) were evaluated with and without internal standard at low QC concentration (4 µg/mL) to assess the specificity of the method.
Accuracy and precision
The intra- and inter-assay precisions were determined using the CV (%), and the intra- and inter-assay accuracies were expressed as the percent difference between the measured concentration and the nominal concentration. The % accuracy of the method was expressed by the formula: %accuracy=(measured concentration)/(nominal concentration) x 100%. Intra-assay precision and accuracy were calculated using replicate (n=6) determinations for each concentration of the spiked plasma sample during a single analytical run. Inter-assay precision and accuracy were calculated using replicate (n=6) determination of each concentration made on three separate days.
Recovery (extraction efficiency) and matrix effect
The extraction efficiency of EACA was determined by analyzing three replicates of EACA plasma samples at three QC concentrations of 4, 40 and 200 µg/mL. Recovery was calculated by comparing the peak areas of EACA added into blank plasma and extracted using the protein precipitation procedure with those obtained from EACA spiked directly into post-protein precipitation solvent at the four QC concentrations. The matrix effect was measured by comparing the peak response of the post-extracted spiked sample with those of the pure standards containing equivalent amounts of the EACA prepared in mobile phases. In addition, post-column infusion method described by Bongfiglio et al. [18] was employed to test matrix effect in six lots of blank plasma.
Stability study
The stability of EACA in human plasma was assessed by analyzing replicates QC samples at concentrations of 4, 40 and 200 µg/mL (n=6), during the sample and storage procedure (in 4 mL amber vials). For all stability studies, freshly prepared and stability testing QC samples were evaluated by using a freshly prepared standard curve for the measurement. The short term stability was assessed after exposure of the plasma samples to room temperature for 24 hours (n=6). The long term stability was assessed after storage of the plasma samples -80°C for up to one year (n=6). The freeze/thaw stability was determined after three freeze/thaw cycles (room temperature to -80°C, n=6). The concentrations obtained from all stability studies were compared to freshly prepared QC samples (n=6), and the percentage concentration deviation was calculated. The analyte was considered stable in human plasma when the concentration difference was less than 15% between the freshly prepared samples and the stability testing samples.
Pharmacokinetics of EACA in children
This assay was implemented for analysis of PK samples from healthy infants aged 2–24 months undergoing craniofacial surgery without history of renal impairment or a history of a coagulation disorder [15]. Subjects were sequentially enrolled in one of the three cohorts. Each subject received an intravenous (IV) loading dose (25 or 50 or 100 mg/kg) of EACA followed by a continuous IV infusion (CIVI) of EACA (10 or 20 or 40 mg/kg/h) as described previously [15]. PK samples, consisting of 1 ml of blood, were drawn (in lithium heparin tubes) immediately before and after the loading dose, after initiation of CIVI (0.5, 2, 4–6 h), at the end of the CIVI, and after the end of the CIVI (0.5, 3, 6, 9, 12, and 15 h), for a maximum total of 12 PK samples [15]. Plasma was separated by centrifugation and stored at -80ºC until analysis.
Results
Linearity, sensitivity and specificity
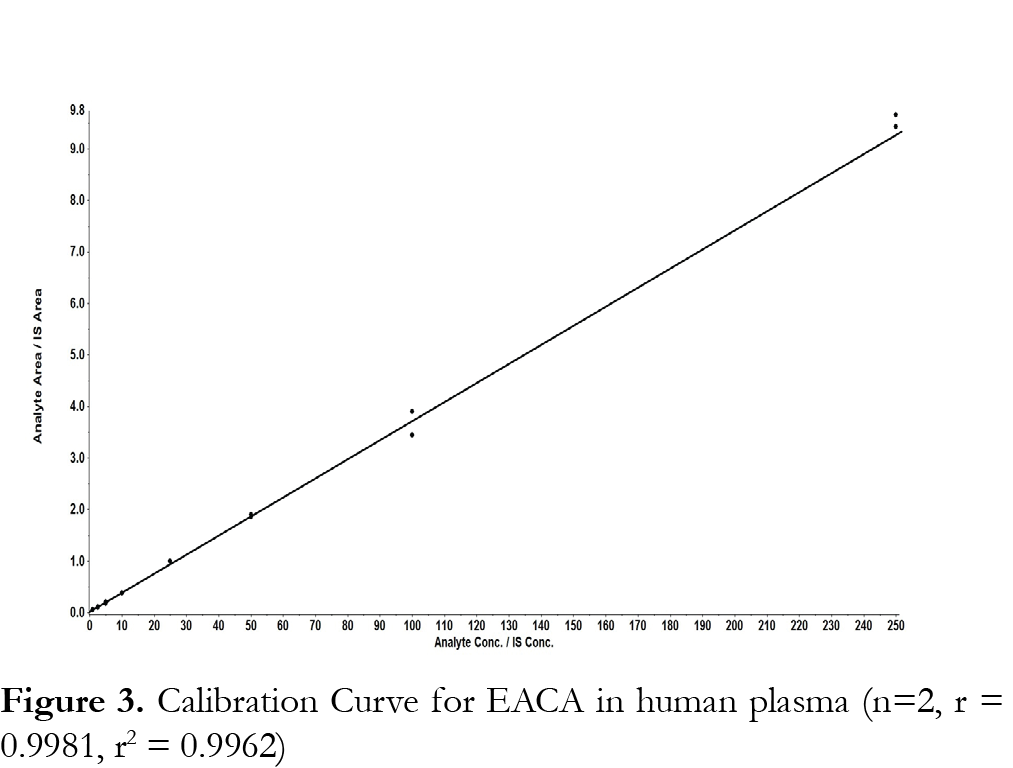
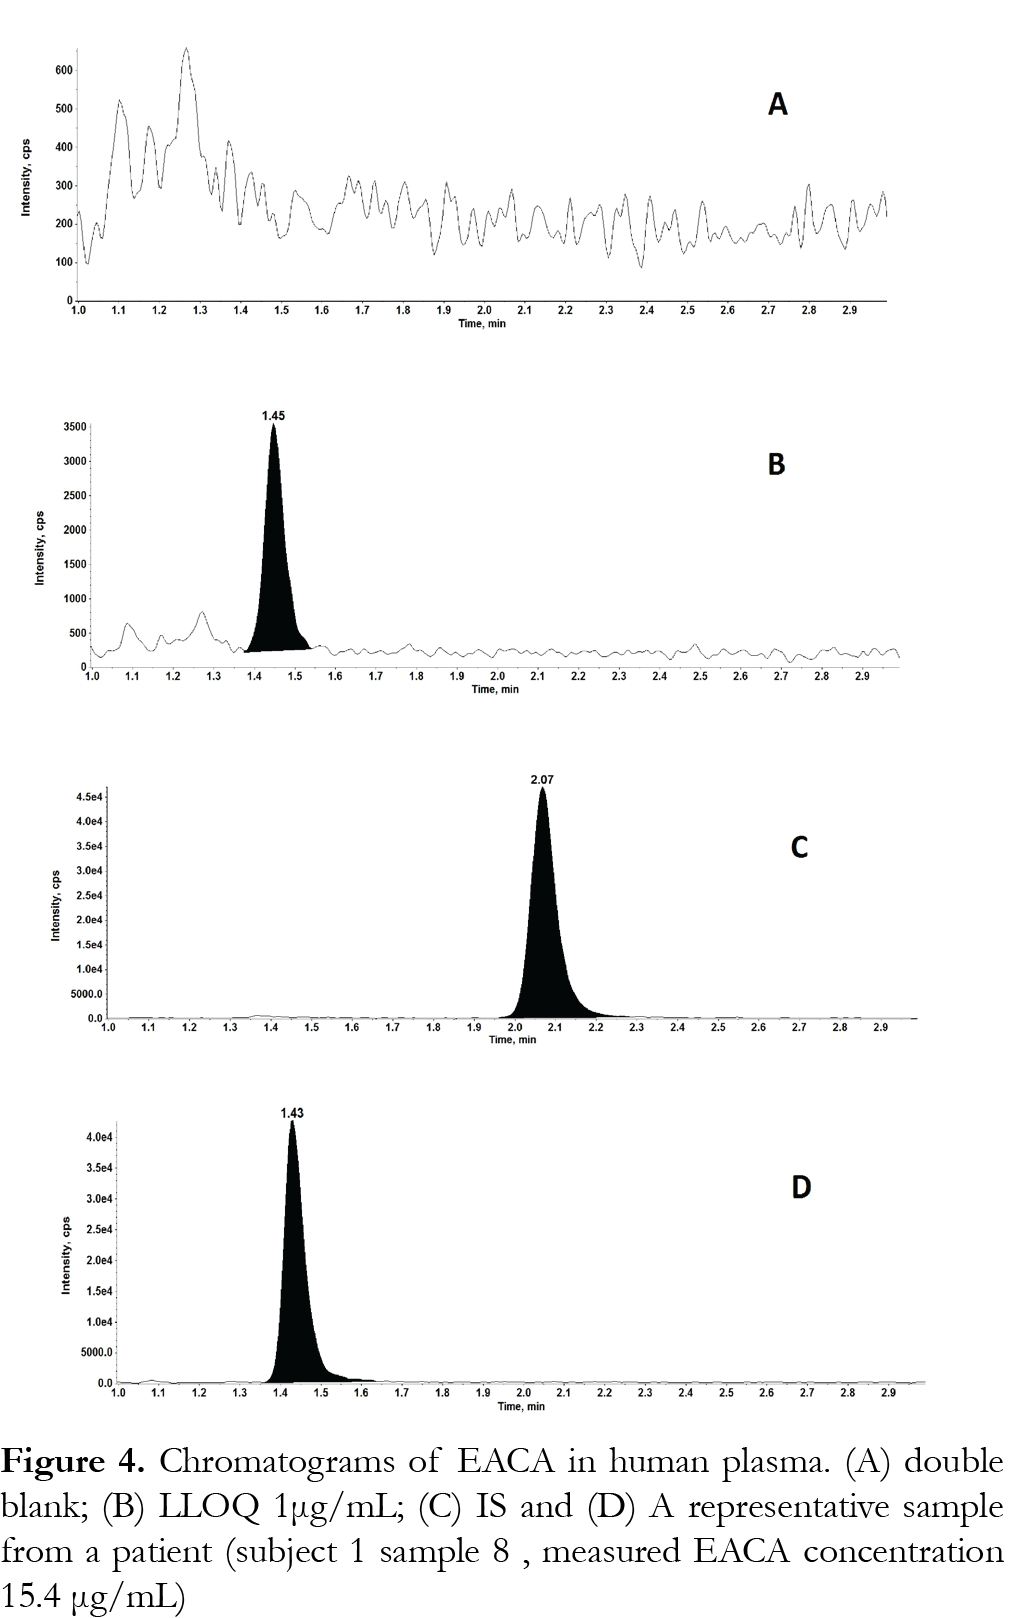
The method was validated at the above criteria and found to be linear for the concentration range of 1 – 250 µg/mL. A representative calibration curve for EACA is shown in Fig. 3. The linear correlation coefficient (r) from inter-day analysis was found to be greater than 0.98 in all cases. The LLOQ was 1 µg/mL, demonstrating a %CV less than 10% (precision) and accuracy greater than 92%, with a signal-to-noise (S/N) ratio of greater than 10. LLOQ was determined as the concentration at which all acceptable criteria are met and the measured concentration was within ±20% of the nominal concentration. The limit of detection (LOD) was 0.25 µg/mL, which was determined by the lowest concentration with acceptable chromatography, the presence of precursor and product ions with a relative retention time within ±2% of average retention time of EACA, an accuracy of within ±20% and a S/N ratio of at least 3 [11]. A representative chromatogram of double blank, LLOQ, internal standard and a clinical plasma sample are shown in Fig. 4.Analysis of six different blank plasma samples and the corresponding spiked low QC (4 µg/mL) showed no significant interference from endogenous compounds (data not shown). No carryover of peaks was observed at the retention time or ion channels of EACA or IS.
Figures and Tables
[Click to enlarge]
Precision and accuracy
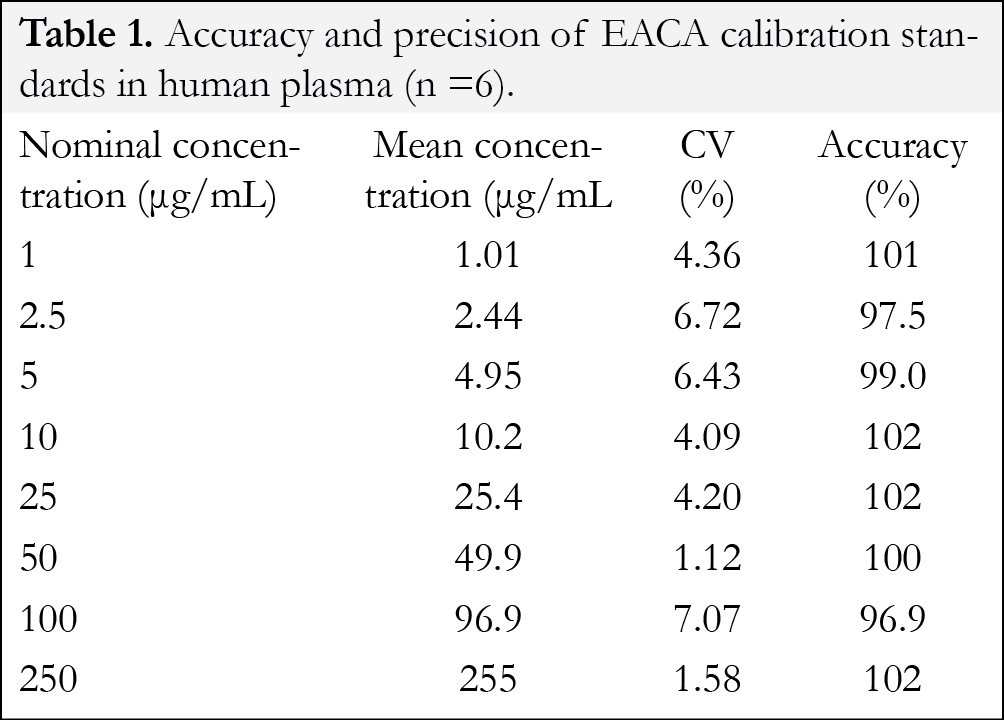
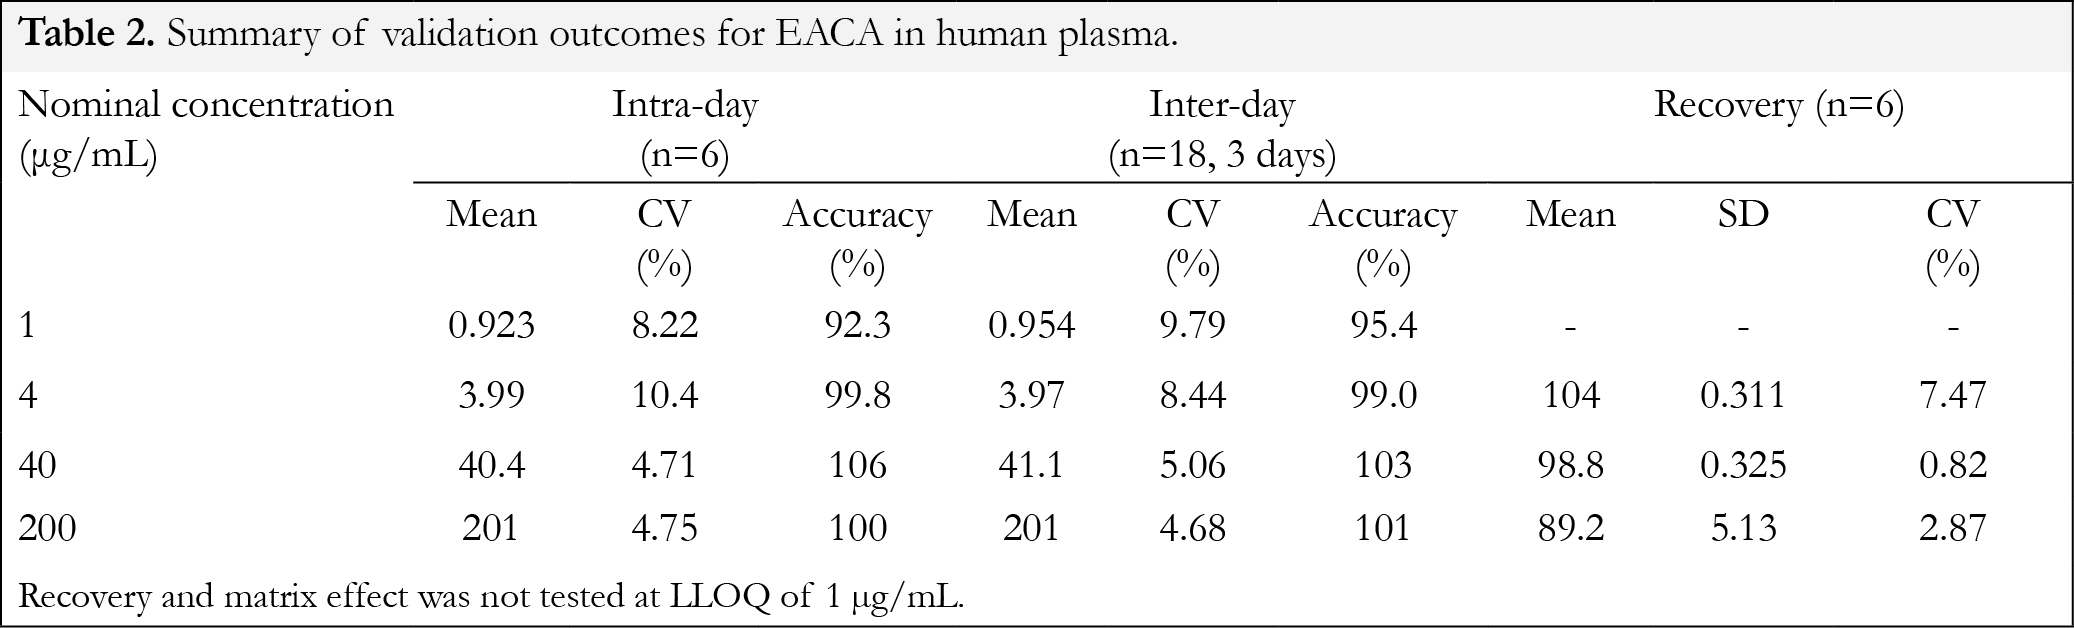
At the eight calibration standards, the intra-day (n=6) precision ranged from 1.1-7.1% and the accuracy ranged from 96.9-102% (Table 1). Validation results for the replicates of quality control samples are depicted in Table 2. The intraday precision (n=6) ranged from 4.71-10.4% with the accuracy ranging from 92.3-106%. The inter-day (n=18, 3 days) precision ranged from 4.68-9.79% with the accuracy ranging from 95.4-103%. These data confirm that the present method has an acceptable accuracy, precision and reproducibility for the quantification of EACA throughout the desired concentration range.
Recovery
At 4, 40 and 200 µg/mL QC concentrations the percent extraction recoveries (mean ± % SD, n=6) after six replicates were 104±0.3, 98.8±0.3 and 89.2 ± 5.13, respectively (Table 2). Data indicated that the extraction efficiency for EACA using protein precipitation was satisfactory and was not concentration dependent.
Assay specificity and ionization suppression (matrix effect)
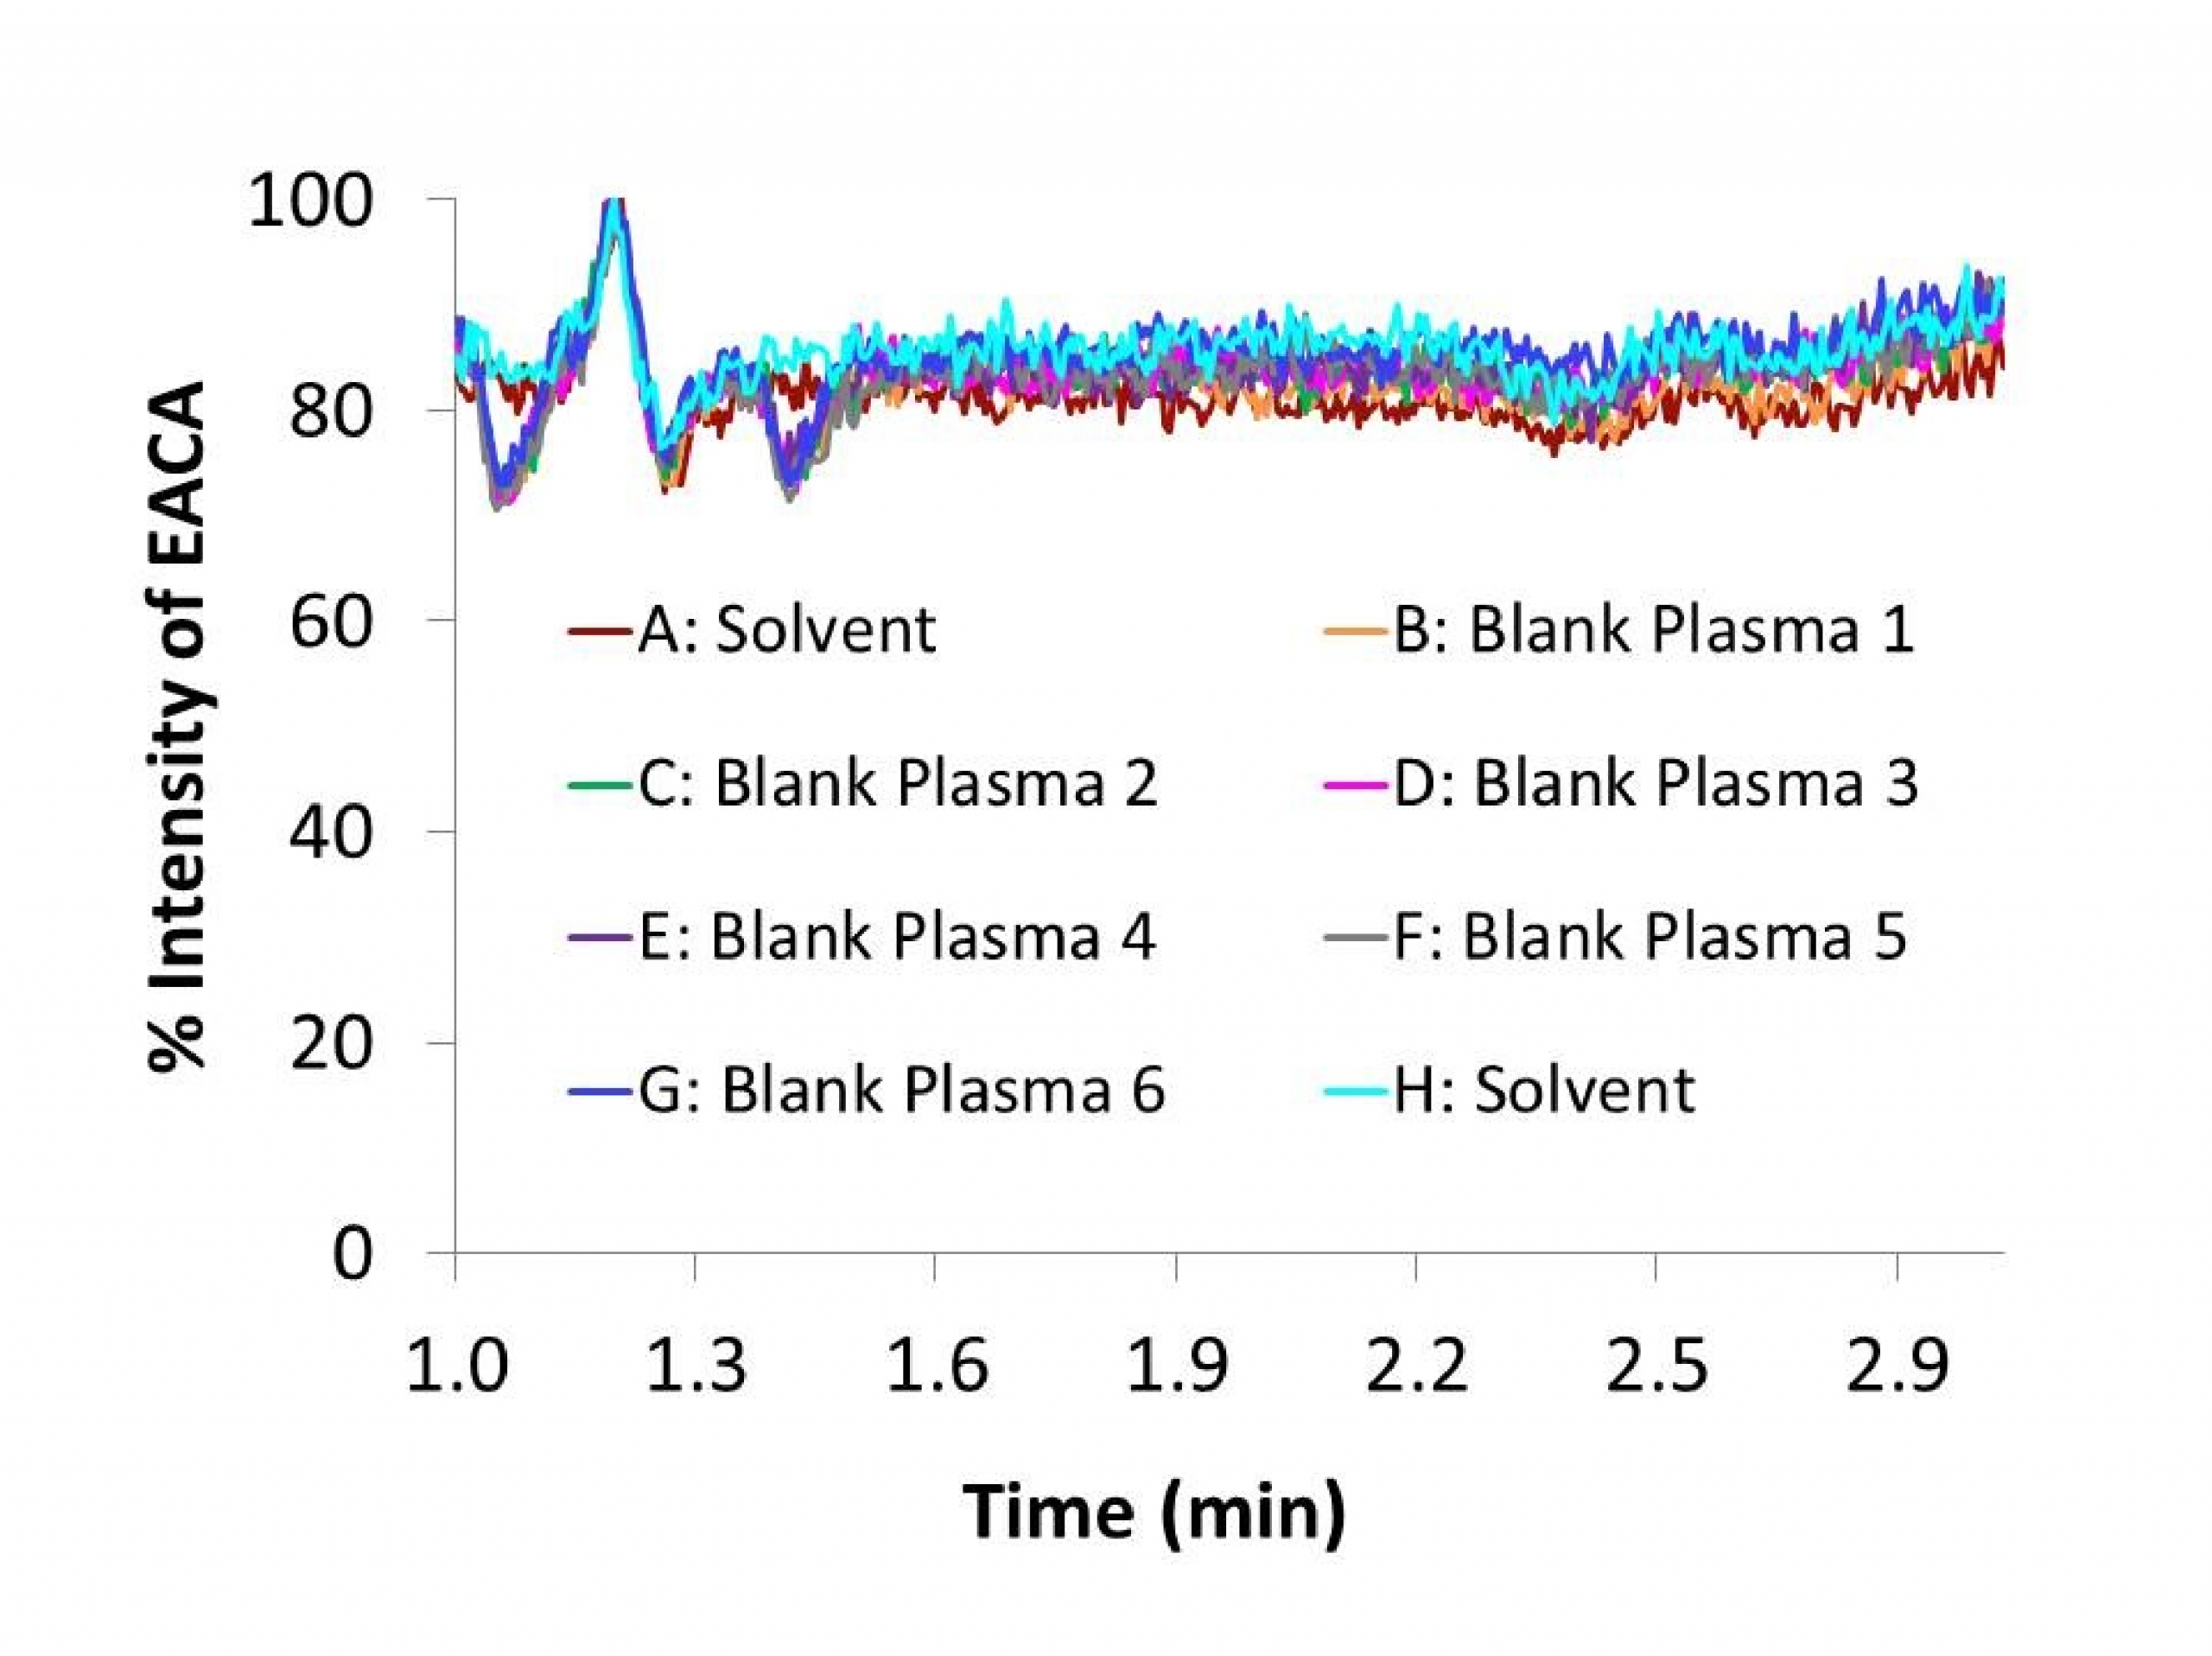
Matrix effect can affect the reproducibility from the analyte or the internal standard of the assay. The matrix effect, or intensity of ion suppression or enhancement is caused by co-eluting matrix components. The matrix effect of EACA and IS were calculated using the following formula: % matrix effect = (A/B) x 100%. A represents the corresponding peak areas of the analytes in spiked plasma post-precipitation and B represents peak responses of the pure standards prepared in mobile phases. A value of >100% indicated ionization enhancement, and a value of <100% indicated ionization suppression. The matrix effect was tested on the three QC concentrations (n=6) and six individual lots of blank plasma were evaluated. At 4, 40 and 200 µg/mL QC concentrations the measured concentrations of EACA (mean ± SD, n=6) in the post-extract spiked samples were 4.11 ± 0.16, 39.5 ± 1.69 and 180 ± 2.23 µg/mL, respectively. To further evaluate matrix effect, blank extracts from 6 lots of human plasma were analyzed by post-column infusion method described by Bongfiglio et. al.[18]. No significant ion suppression was seen at the retention time of EACA in the infusion chromatograms (Fig. 5), confirming that there was minimal or no matrix effect observed for EACA after 1: 2040 plasma dilution and the HPLC separation.
EACA stability
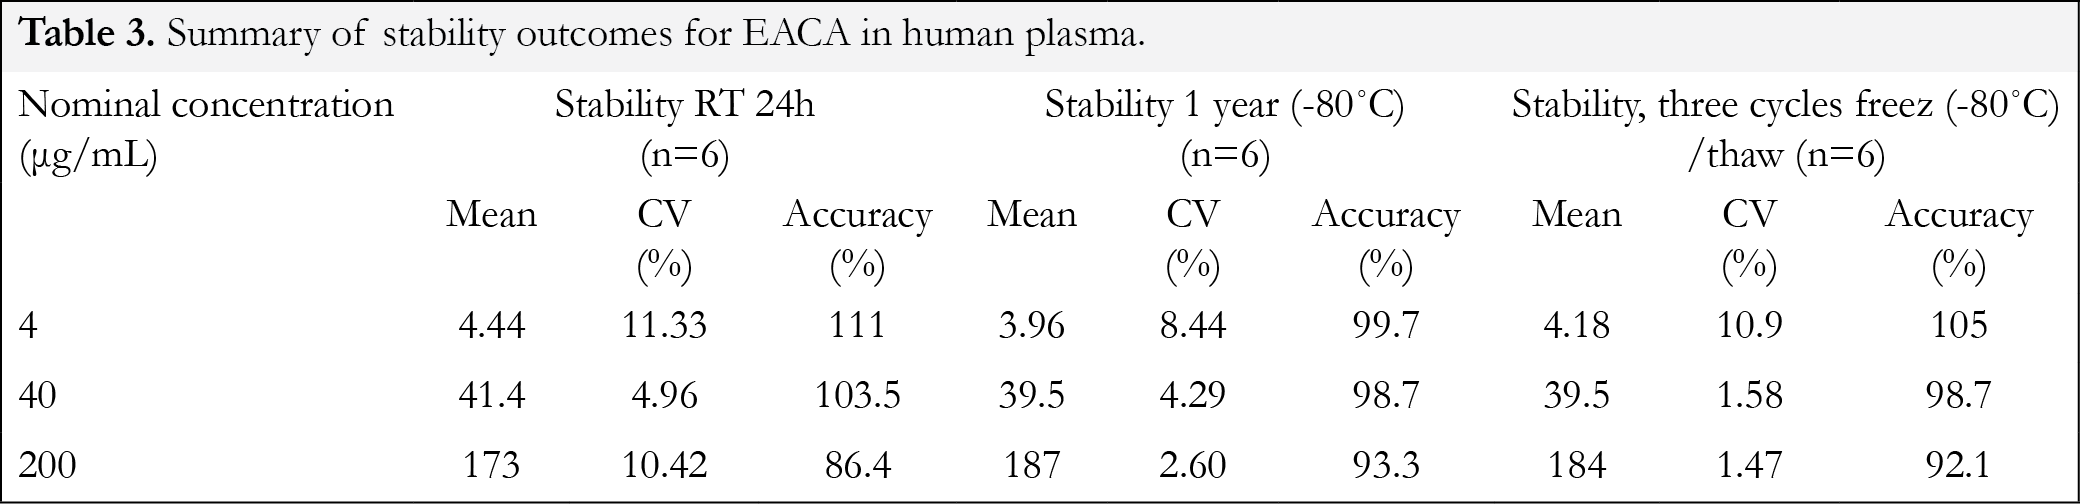
The stability of EACA was investigated to cover expected conditions during sample preparation and storage for all samples, which include data from freeze/thaw, short-term and long-term stability studies (Table 3). The precision for freeze/thaw samples (n=6) ranged from 1.4-10.9% and the accuracy ranged from 92.1-105%. The results indicated that the analyte was stable in plasma for three cycles when stored at -80 °C and thawed to room temperature. The precision for 24 hour bench-top stability (n=6) ranged from 5 -11.3% and the accuracy ranged from 86.4-111%. After 1 year storage at -80°C (n=6), the precision for the quality control samples ranged from 2.6 -8.44% and the accuracy ranged from 93.3-99.7%. These results indicated reliable stability under the experimental conditions of the analytical runs and storage conditions.
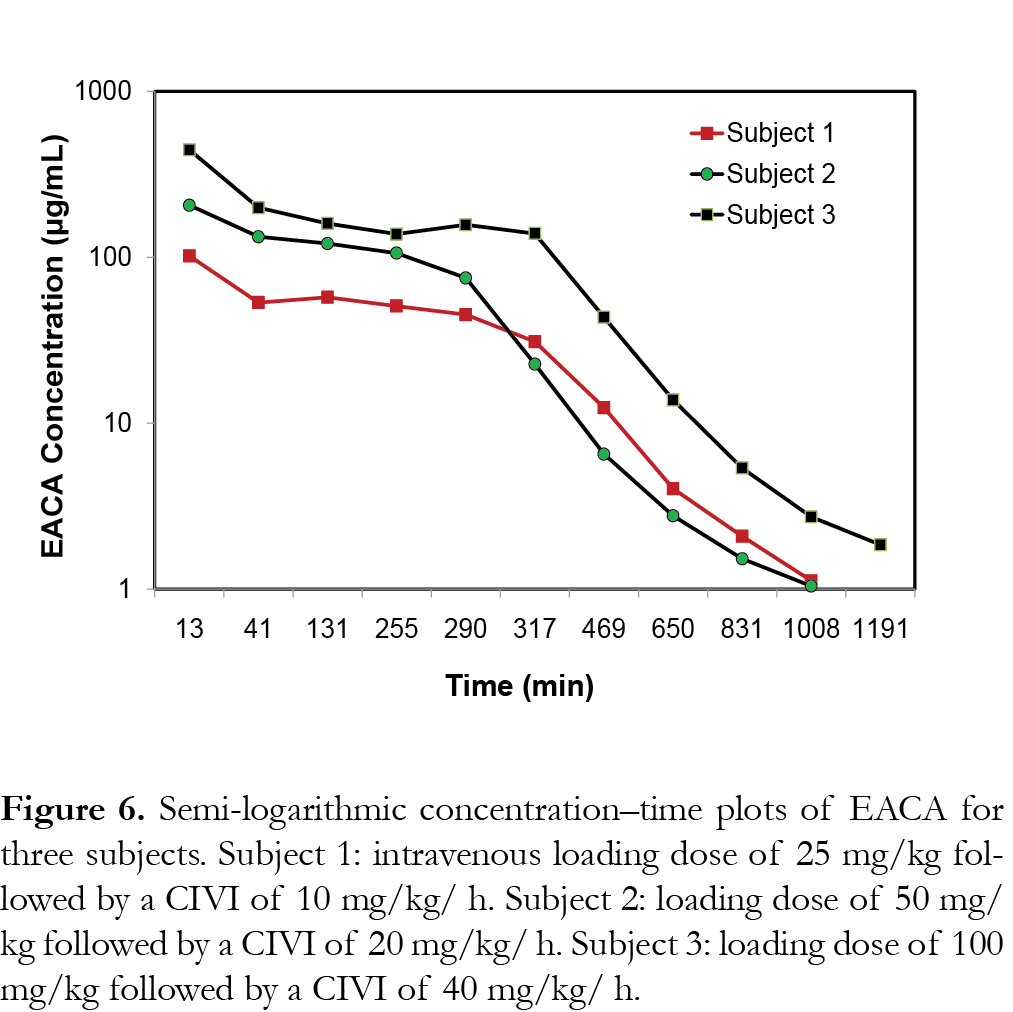
Pharmacokinetics of EACA in children
The representative PK profiles of EACA in 3 subjects are shown in Fig. 6. Subject 1 received an IV loading dose of 25 mg/kg followed by a CIVI of 10 mg/kg/h of EACA (cohort 1), subject 2 received an IV loading dose of 50 mg/kg followed by a CIVI of 20 mg/kg/h of EACA (cohort 2) and subject 3 received an IV loading dose of 100 mg/kg followed by a CIVI of 40 mg/kg/h of EACA (cohort 3) as described previously [15]. The results show that the assay range was appropriate for analysis of EACA in pediatric plasma samples from the clinical trials [14, 15].
Discussion
EACA is a potent antifibrinolytic agent that inhibits plasmin-plasminogen system [5]. EACA is a natural product that is present in wine lees [19] and cyclized product of EACA, caprolactam is used as an intermediate in synthesis of nylon 6 [20, 21]. We developed an EACA assay that has a rapid sample preparation (1:2040 dilution min-plasminogen system [5]. EACA is a natural product that is present in wine lees [19] and cyclized product of EACA, caprolactam is used as an intermediate in synthesis of nylon 6 [20, 21]. We developed an EACA assay that has a rapid sample preparation (1:2040 dilutionof plasma samples) and a selective LC-MS/MS method capable of analyzing small volumes of plasma samples, which is ideal for use in pediatric clinical trials [14, 15]. The LC-MS/MS assay reported here accurately and precisely quantitates EACA concentration in 50 µL plasma specimens with a limit of quantification of 1 µg/mL. The intra-day and inter-day coefficients of variation were less than 10.4% at all concentrations tested. Assay range of 1-250 µg/mL is well suited for expected concentration ranges in pediatric pharmacokinetic studies. EACA had good recovery and stability under assay conditions. Our stability data is consistent with the reported results that EACA was stable at 20ºC for 3 months [22]. At higher temperature (50 –80ºC), EACA degrades to form small amounts of dimer, trimer and caprolactam. However, in urine samples EACA was reported to be stable only for 3 days at 4ºC [11]. There was no significant carryover or matrix effect observed for EACA with six different lots of blank plasma in post-column infusion studies. However, there was a significant matrix effect observed with urine samples for EACA analysis and the issue was resolved by diluting and analyzing urine samples [11]. This is consistent with our finding that there was no significant matrix effect from 1:2040 diluted plasma samples. We were able to take advantage of the selectivity and sensitivity of LC-MS/MS and high concentrations of EACA expected in clinical samples and develop a simple and reliable assay for the determination of EACA in human plasma. The minimum effective concentration of EACA to control systemic fibrinolytic activity was determined to be 130 µg/mL [23-25]. Various dosing strategies based on PK studies in adults [26, 27] and children [28] have been targeted to maintain plasma EACA levels at or above this therapeutic concentration. Previous pharmacokinetic studies of EACA have shown that renal excretion was the major route of elimination, whether administered orally or IV [29-33]. Approximately 65–75% of the dose is eliminated in the urine as unchanged drug while ~11% of the dose excreted as adipic acid [29, 30, 32, 33]. EACA pharmacokinetics is influenced by weight, age, and perioperative conditions. Weight-based dosing was suggested based on the modelling, a loading dose of 100 mg/kg followed by a CIVI of 40 mg/kg/h is appropriate to maintain target plasma EACA concentrations in patients 6–24 months of age [15]. EACA was well tolerated and no adverse events were attributed to its administration. This assay has been successfully utilized for analysis of EACA in clinical studies [14, 15].
Conclusion
A fast, simple and reliable LC-MS/MS method has been developed for the determination of isoniazid, pyrazinamide and ethambutol in human serum. Isoniazid, pyrazinamide and especially ethambutol have proven to be low protein bound. Therefore, ultrafiltration as a means of sample preparation could be applied. The method adheres to all the validation criteria and is suitable for the simultaneous determination of isoniazid, pyrazinamide and ethambutol in human serum for therapeutic drug monitoring and pharmacokinetic studies.
References
1. Stricker PA, Shaw TL, Desouza DG et al. Blood loss, replacement, and associated morbidity in infants and children undergoing craniofacial surgery. Paediatr Anaesth 20(2), 150-159 (2010). [CrossRef]
2. Van Aelbrouck C, Englberger L, Faraoni D. Review of the fibrinolytic system: comparison of different antifibrinolytics used during cardiopulmonary bypass. Recent Pat Cardiovasc Drug Discov 7(3), 175-179 (2012). [CrossRef]
3. Silva MM, Thelwell C, Williams SC, Longstaff C. Regulation of fibrinolysis by C-terminal lysines operates through plasminogen and plasmin but not tissue-type plasminogen activator. J Thromb Haemost 10(11), 2354-2360 (2012). [CrossRef]
4. Nesheim M, Bajzar L. The discovery of TAFI. J Thromb Haemost 3(10), 2139-2146 (2005). [CrossRef]
5. Griffin JD, Ellman L. Epsilon-aminocaproic acid (EACA). Semin Thromb Hemost 5(1), 27-40 (1978). [CrossRef]
6. Longstaff C. Studies on the mechanisms of action of aprotinin and tranexamic acid as plasmin inhibitors and antifibrinolytic agents. Blood Coagul Fibrinolysis 5(4), 537-542 (1994). [CrossRef]
7. Adams RF, Schmidt GJ, Vandemark FL. Determination of epsilon-aminocaproic acid in serum by reversed-phase chromatography with fluorescence detection. Clin Chem 23(7), 1226-1229 (1977). [CrossRef]
8. Lacroix C, Levert P, Laine G, Goulle JP. Microanalysis of two antifibrinolytics (epsilon-aminocaproic acid and tranexamic acid) by liquid chromatography and fluorometry. J Chromatogr 309(1), 183-186 (1984). [CrossRef]
9. Lam S. High performance liquid chromatographic assay of Amicar, epsilon-aminocaproic acid, in plasma and urine after pre-column derivatization with o-phthalaldehyde for fluorescence detection. Biomed Chromatogr 4(4), 175-177 (1990). [CrossRef]
10. Marunouchi T, Ono M, Nakajima T, Ito Y, Aketo T. Simultaneous determination of active ingredients in an ophthalmic solution by isocratic tandem-mode HPLC connected reverse phase column and strong cation exchange column. J Pharm Biomed Anal 40(2), 331-337 (2006). [CrossRef]
11. Wu YH, Wu ML, Lin CC et al. Determination of caprolactam and 6-aminocaproic acid in human urine using hydrophilic interaction liquid chromatography-tandem mass spectrometry. J Chromatogr B Analyt Technol Biomed Life Sci 885-886, 61-65 (2012). [CrossRef]
12. Delavenne X, Montbel A, Hodin S, Zufferey P, Basset T. Quantification of total and unbound tranexamic acid in human plasma by ultrafiltration liquid chromatography/tandem mass spectrometry: application to pharmacokinetic analysis. J Pharm Biomed Anal 91, 32-36 (2014). [CrossRef]
13. Grassin Delyle S, Abe E, Batisse A et al. A validated assay for the quantitative analysis of tranexamic acid in human serum by liquid chromatography coupled with electrospray ionization mass spectrometry. Clin Chim Acta 411(5-6), 438-443 (2010). [CrossRef]
14. Stricker PA, Gastonguay MR, Singh D et al. Population pharmacokinetics of -aminocaproic acid in adolescents undergoing posterior spinal fusion surgery. Br J Anaesth 114(4), 689-699 (2015). [CrossRef]
15. Stricker PA, Zuppa AF, Fiadjoe JE et al. Population pharmacokinetics of epsilon-aminocaproic acid in infants undergoing craniofacial reconstruction surgery. Br J Anaesth 110(5), 788-799 (2013). [CrossRef]
16. FDA. Guidance for Industry: Bioanalytical Methods Validation. (2001).
17. Bansal S, Destefano A. Key elements of bioanalytical method validation for small molecules. AAPS J 9(1), E109-114 (2007). [CrossRef]
18. Bonfiglio R, King RC, Olah TV, Merkle K. The effects of sample preparation methods on the variability of the electrospray ionization response for model drug compounds. Rapid Commun Mass Spectrom 13(12), 1175-1185 (1999). [CrossRef]
19. Delgado De La Torre MP, Priego-Capote F, Luque De Castro MD. Characterization and Comparison of Wine Lees by Liquid Chromatography-Mass Spectrometry in High-Resolution Mode. J Agric Food Chem, (2015). [CrossRef]
20. Ragaini V, Guaita C, Pirola C. The beneficial influence of ultrasound in the polymerization of epsilon-caprolactam to polyamide-6 (Nylon 6). Part I: primary experimental results. Ultrason Sonochem 14(6), 680-688 (2007). [CrossRef]
21. Ragaini V, Pirola C, Rocco G, Guaita C. The beneficial influence of ultrasound in the polymerization of epsilon-caprolactam to polyamide-6 (Nylon 6). Part II: additional experiment to understand the “pre-sonication effect”. Ultrason Sonochem 14(6), 689-694 (2007). [CrossRef]
22. Schou-Pedersen AM, Cornett C, Nyberg N, Ostergaard J, Hansen SH. Structure elucidation and quantification of impurities formed between 6-aminocaproic acid and the excipients citric acid and sorbitol in an oral solution using high-resolution mass spectrometry and nuclear magnetic resonance spectroscopy. J Pharm Biomed Anal 107, 333-340 (2015). [CrossRef]
23. Ablondi FB, Hagan JJ, Philips M, De Renzo EC. Inhibition of plasmin, trypsin and the streptokinase-activated fibrinolytic system by 6-aminocaproic acid. Arch Biochem Biophys 82(1), 153-160 (1959). [CrossRef]
24. Abou-Diwan C, Sniecinski RM, Szlam F et al. Plasma and cerebral spinal fluid tranexamic acid quantitation in cardiopulmonary bypass patients. J Chromatogr B Analyt Technol Biomed Life Sci 879(7-8), 553-556 (2011). [CrossRef]
25. Fish SS, Pancorbo S, Berkseth R. Pharmacokinetics of epsilon-aminocaproic acid during peritoneal dialysis. J Neurosurg 54(6), 736-739 (1981). [CrossRef]
26. Bennett-Guerrero E, Sorohan JG, Canada AT et al. epsilon-Aminocaproic acid plasma levels during cardiopulmonary bypass. Anesth Analg 85(2), 248-251 (1997). [CrossRef]
27. Butterworth J, James RL, Lin Y, Prielipp RC, Hudspeth AS. Pharmacokinetics of epsilon-aminocaproic acid in patients undergoing aortocoronary bypass surgery. Anesthesiology 90(6), 1624-1635 (1999). [CrossRef]
28. Ririe DG, James RL, O’brien JJ et al. The pharmacokinetics of epsilon-aminocaproic acid in children undergoing surgical repair of congenital heart defects. Anesth Analg 94(1), 44-49 (2002). [CrossRef]
29. Andersson L, Nilsoon IM, Colleen S, Granstrand B, Melander B. Role of urokinase and tissue activator in sustaining bleeding and the management thereof with EACA and AMCA. Ann N Y Acad Sci 146(2), 642-658 (1968). [CrossRef]
30. Frederiksen MC, Bowsher DJ, Ruo TI et al. Kinetics of epsilon-aminocaproic acid distribution, elimination, and antifibrinolytic effects in normal subjects. Clin Pharmacol Ther 35(3), 387-393 (1984). [CrossRef]
31. Mcnicol GP, Browne MK, Bayley C, Douglas AS. Pathological fibrinolytic states and their treatment with epsilon aminocaproic acid (EACA). Br J Surg 53(1), 26-29 (1966). [CrossRef]
32. Nilsson IM. Clinical pharmacology of aminocaproic and tranexamic acids. J Clin Pathol Suppl (R Coll Pathol) 14, 41-47 (1980). [CrossRef]
33. Nilsson IM, Sjoerdsma A, Waldenstrom J. Antifibrinolytic activity and metabolism of 6-aminocaproic acid in man. Lancet 1(7138), 1322-1326 (1960). [CrossRef]
All site content, except where otherwise noted, is licensed under a Creative Commons Attribution 4.0 License
