OPEN-ACCESS PEER-REVIEWED
RESEARCH ARTICLE
Estela Skende1, Lei Shi1, Nancy Zheng2, Yu-Luan Chen1,*
1Sunovion Pharmaceuticals Inc., Marlborough, MA 01752, USA. 2PPD Bioanalytical Laboratory, Middleton, WI 53562, USA.
Journal of Applied Bioanalysis. Vol.5. No.2. pages 20-33 (2019)
Published 15 April 2019. https://doi.org/10.17145/jab.19.005 | (ISSN 2405-710X)
*Correspondence:
Chen Y-L. . Sunovion Pharmaceuticals Inc., 84 Waterford Drive, Marlborough, MA 01752, USA. Phone: +1 508 7874286; Fax: +1 508 3577859.
Citation:
Skende E, Shi L, Zheng N, Chen YL. Direct Quantitation of D-serine in Human Plasma by Enantioselective Liquid Chromatography with Tandem Mass Spectrometry and its Application to a Clinical Study.
J Appl Bioanal 5(2), 20-33 (2019).
Editor: Dr. Lake Paul, Abzena, Bristol, PA, USA.
Open-access and Copyright:
©2019 Skende E et al. This article is an open access article distributed under the terms of the Creative Commons Attribution License (CC-BY) which permits any use, distribution, and reproduction in any medium, provided the original author(s) and source are credited.
Funding/Manuscript writing assistance:
The authors have financial support or funding to report and they declare that no writing assistance was utilized in the production of this article.
Competing interest:
The authors have declared that no competing interest exist.
Article history:
Received 17 January 2019, Revised 22 February 2019, Accepted 26 February 2019.
Abstract
Objectives
Develop and validate a simple and rapid LC-MS/MS method for plasma D-serine measurement to support clinical development of a potential D-amino-acid oxidase (DAAO) inhibitor.
Methods
Calibration standards in phosphate buffered saline (PBS), quality control samples (QCs) in both PBS and human plasma were extracted with methanol. Enantioselective separation of D- and L-serine was on a Regis® ChiroSil RCA(+) column with monitoring underivatized D-serine at m/z 106.1→ 60.1 and (D, L)-serine-d3 internal standard at 109.0 → 63.0.
Results
The validation showed all calibration curves with a correlation coefficient of ≥ 0.9997, and plasma QC samples’ inter-run (n = 18) CV of ≤ 8.7% and REs from -7.0% to -6.1%. The plasma samples were stable for 6 freeze-thaw cycles, 36.5 h ambient storage, and 769 days at -20°C or lower.
Conclusions
The validated method was successfully applied to analyze plasma D-serine level in a Phase I clinical trial and the D-serine level was insignificantly impacted by the studied compound.
Keywords
D-serine, human plasma, endogenous biomarker, enantioselective separation.
Introduction
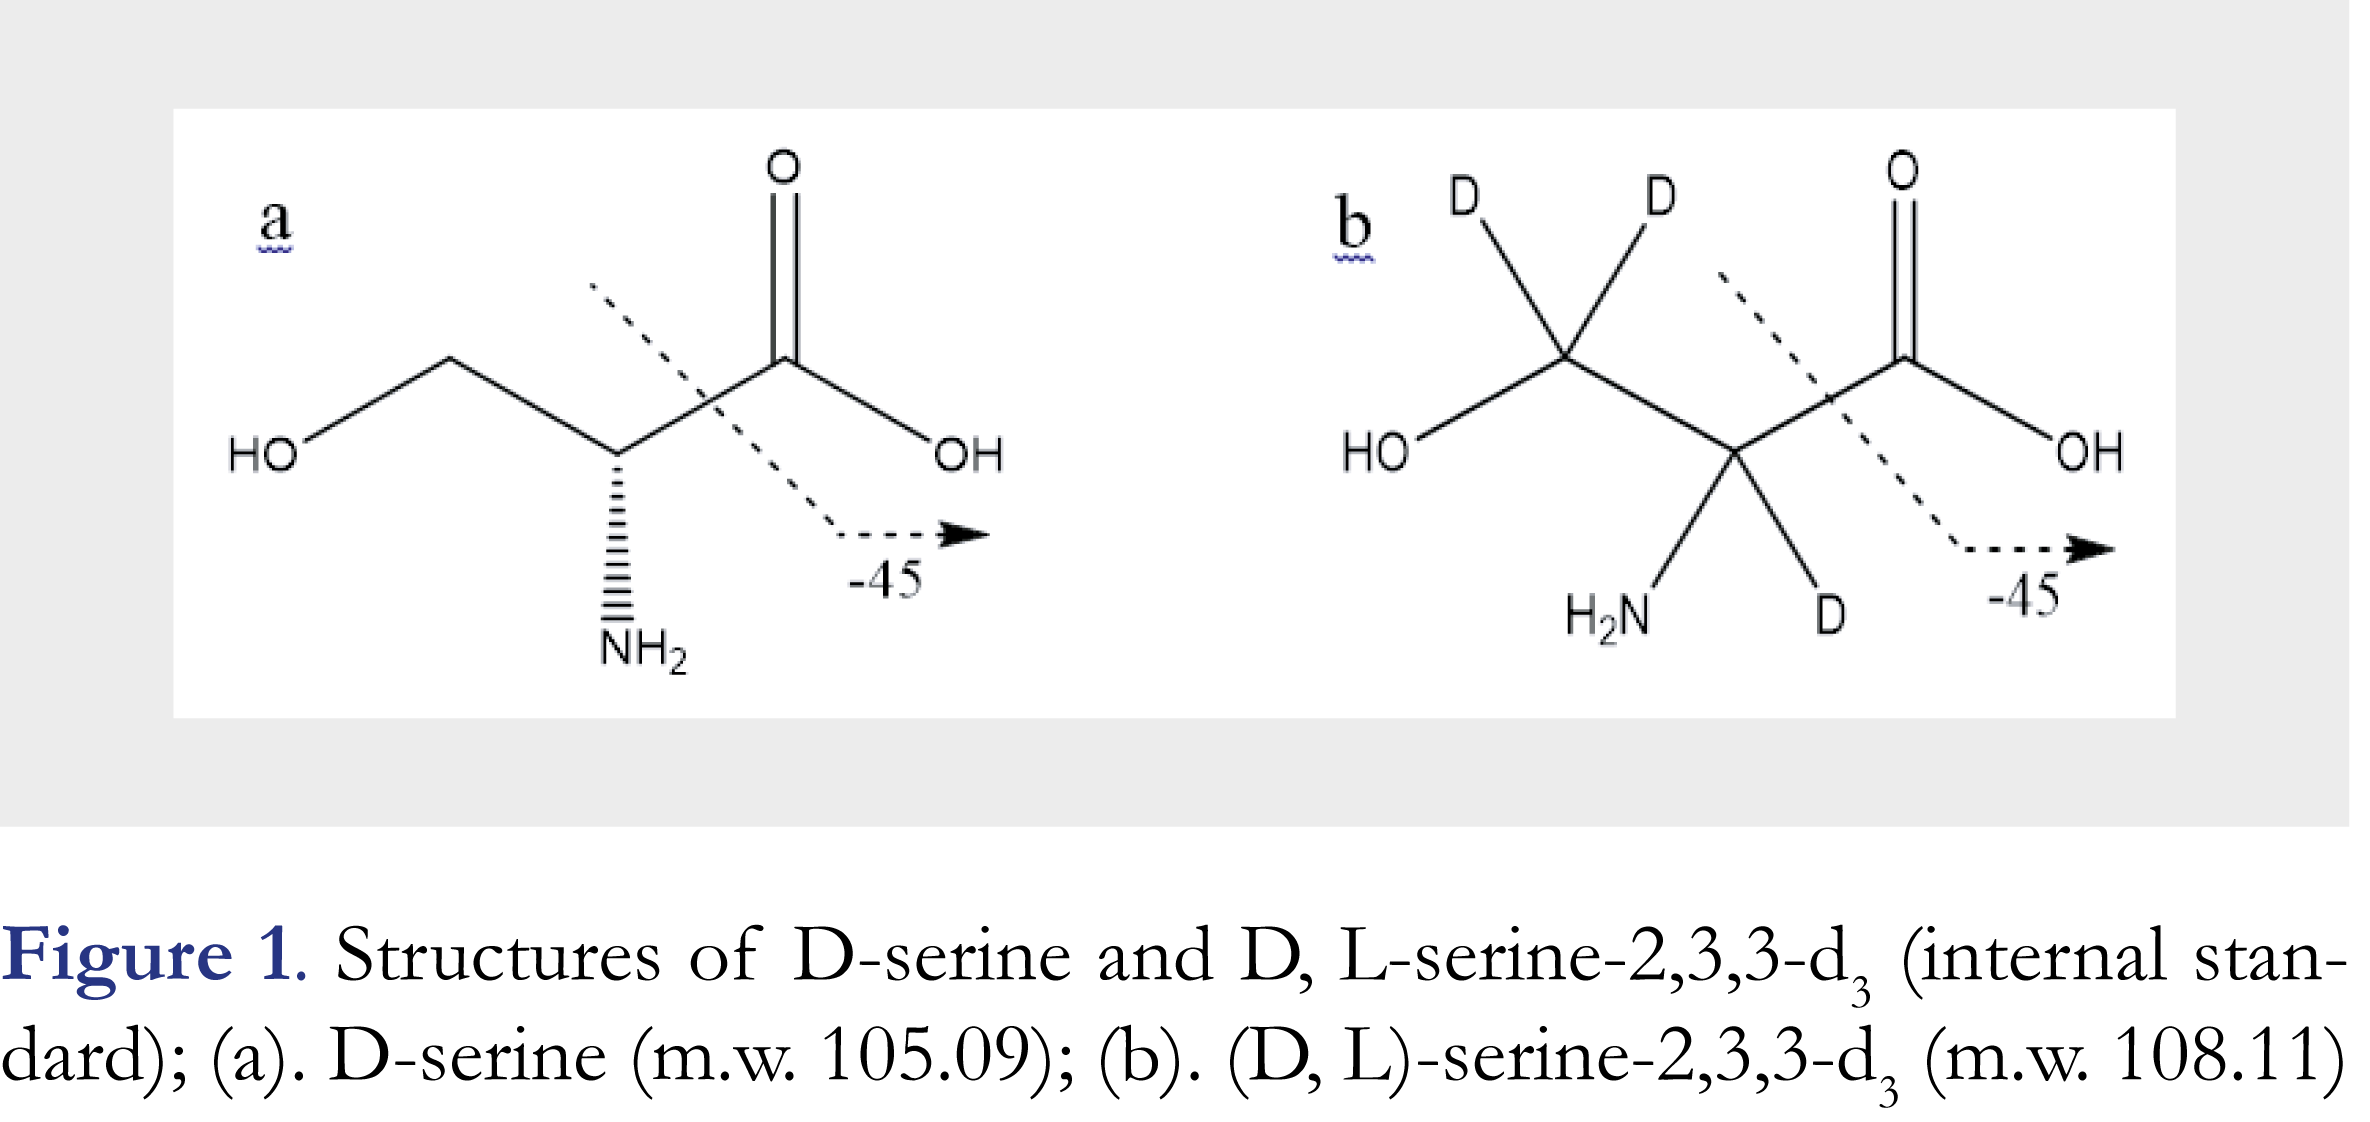
D-serine, (2R)-2-amino-3-hydroxypropanoic acid, as shown in Figure 1a, is a well-known endogenous co-agonist of the N-methyl-D-aspartate-type glutamate receptor (NMDA receptor) that belongs to a family of neurotransmitter receptors in nerve cells and plays key roles in learning, memory and neuroplasticity functions [1-3]. D-serine is a neuromodulator that regulates the activities of neurons. Because of the importance of NMDA receptor in brain activities, D-serine levels in human plasma, cerebrospinal fluid (CSF), and urine are often considered as a biomarker in drug development for neuropathic pain, cognitive deficits by acute stress or impairment associated with schizophrenia (CIAS), and Alzheimer’s disease (AD) etc. [4-7].
Several analytical methods were published for monitoring D-serine levels in various biological matrices [7-27]. In those methods, D-serine was quantitatively measured through either enzymatic assays using D-serine dehydratase [8], enzymatic-HPLC [9], or capillary electrophoresis (CE) [10-14], or chromatographic assays such as GC-MS, LC-UV, LC-fluorescence, and LC-MS/MS [15-27]. In order to improve method selectivity and sensitivity, chemical derivatization with various reagents such as 7-fluoro-4-nitrobenzoxadiazole [17], 9-fluorenylmethyl chloroformate and dansyl chloride [20], 1-fluoro-2-4-dinitrophenyl-5-L-alanine amide (Marfey’s reagent) [21, 22, 27], o-phthalaldehyde (OPA), β-mercaptoethanol/OPA, N-tert-butyloxy-carbonyl-L-cysteine/OPA [23], naphthalene-2,3-dicarboxaldehyde (NDA), 4-(dimethylamino) azobenzene-4’-sulfonyl (dabsyl) chloride [24], and (R)-1-boc-2-piperidine carbonyl chloride [25] etc., were widely used in the reported D-serine measurement assays. Sample preparation procedures with chemical derivatization are capable of improving separation and ionization efficiency (for mass spectrometric detection) but often time-consuming and require proficient experimental skills. As a result, it often limits the throughput and robustness of an analytical method.
D-serine is a naturally endogenous compound in humans, and as such there are no analyte-free matrices available for the calibration standards and quality control samples preparation. Thus, a typical way to conduct the method validation is unrealistic. To overcome this challenge, different strategies have been employed, including using standard subtraction, or using surrogate matrices or surrogate analytes [26].
In this paper, we present a simple and rapid enantioselective LC-MS/MS method for direct determination of D-serine in human plasma without additional chemical derivatization step. Phosphate buffered saline (PBS) was used as the surrogate matrix for the preparation of calibration standards. The quality control samples (QCs) were prepared in both PBS and in real human plasma matrix. The method was fully validated and then has been applied for sample analysis in a phase I study for SEP-227900, a potential competitive inhibitor of D-amino-acid oxidase (DAAO) for treating chronic neuropathic pain, mentioned in [28].
Materials and methods
Chemicals, materials and apparatus
D-serine, as shown in Figure 1a, with a purity > 99% was purchased from Sigma-Aldrich (St. Louis, MO, USA). D, L-serine-2,3,3-d3 (internal standard, IS), as shown in Figure 1b, with a purity > 99% was from CDN ISOTOPES, Inc. (Pointe-Claire, Quebec, Canada). HPLC grade 2-propanol was from J.T. Baker (Center Valley, PA, USA), AR grade ethylene glycol (100%) from Mallinckrodt (Center Valley, PA, USA), formic acid (98+%), HPLC grade methanol from EMD (Gibbstown, NJ, USA) and phosphate buffered saline (PBS, pH 7.4) in foil pouches (Part # P-5368) from Sigma-Aldrich (St. Louis, MO, USA). Ultra-pure water with resistivity >18 MΩ cm-1 was generated by an in-house Milli-Q water purification system (Merck KGaA, Darmstadt, Germany). Blank human plasma with K2-EDTA anticoagulant was purchased from Biological Specialties (Colmar, PA, USA). A Sciex API 4000 triple quadrupole mass spectrometer (Concord, Canada) was interfaced to a Shimadzu LC10ADVP pump and a SIL HTC autosampler (Kyoto, Japan).
ChiroSil RCA(+) 150 x 4.6 mm (5-µm) column from Regis (Morton Grove, IL, USA) was used for enantiomeric separation. Phenomenex C18 Security Guard™ cartridge 4.0 x 2.0 mm (5-µm) (Torrance, CA, USA) was also used to protect the chiral separation column. The Analyst software version 1.4 from Sciex was used for data acquisition and calculation.
LC-MS/MS conditions
The optimized isocratic mobile phase used in this method was a mixture of 0.2% formic acid in water-0.2% formic acid in methanol at a ratio of 45:55 (v/v). The flow-rate was 0.80 mL/min. The column was operated at ambient temperature (~22 °C). The autosampler was with a cooler set at 5 °C. The injection volume was 10 µL. There was no carryover when the methanol containing 0.2% formic acid was used for injector wash. The per sample run time was about 7 min.
In this method, a turbo ionspray source operated in positive mode (ESI+) was employed to generate the molecular ions for mass spectrometric detection. The multiple-reaction mode (MRM) was used to acquire ion counts of the analyte and the IS at different time points. The optimized source parameters included a high voltage of 5.5 kV for the sprayer, the source temperature of 550 °C, the settings of Gas 1, Gas 2, curtain gas, and collision gas at 60, 60, 30, and 10 (arbitrary scale), respectively. Other optimized conditions included declustering potential (DP) of 34 V, entrance potential (EP) of 6 V, collision energy (CE) of 16 eV, and collision cell exit potential (CXP) of 11 V for both D-serine and the IS. MS/MS detection was by monitoring mass transitions at m/z 106.1 [M+H]+→ 60.1 for D-serine and at m/z 109.0 [M+H]+ → 63.0 for the IS, respectively. The fragmentations of D-serine and D-serine-d3 were by breakdown of C-C bonds as indicated in Figures 1a and 1b and loss of a [H]-CO2H group. The dwell times were set as 500 milliseconds for D-serine and 200 milliseconds for the IS. Both Q1 and Q3 quadrupoles were set at unit resolution.
Standard solutions and quality control (QC) samples
The D-serine stock solutions from two separate weighings were made at 250 µg/mL in methanol-water (1:1, v/v) by sonicating for approximately 15 min. The IS stock solution was made at 100 µg/mL in methanol-water (1:1, v/v) in the same way. The IS working solution was 5.00 µg/mL in methanol-water (1:1, v/v). All stock solutions and working standard solutions were stored in a freezer set at -20 °C. Under this condition, the stability of 293 days for both D-serine and the IS stock solution was confirmed.
D-serine is an endogenous entity in humans. For this plasma method validation, calibration standards were prepared at 100, 150, 200, 500, 1000, 2500, 4000 and 5000 ng/mL of D-serine in PBS. One set of QC samples were prepared at 200 (Low), 300 (mid-Low), 750 (Mid), 1500 (mid-High) and 3750 ng/mL (High) of D-serine in PBS and another set of QC samples were prepared at 394 (Low), 944 (Mid) and 3940 (High) ng/mL of D-serine in human plasma (endogenous + spiked). The endogenous D-serine level in the blank plasma pool used for these plasma QCs preparation was pre-determined to be 194 ng/mL based on the PBS calibration curve. The nominal plasma QC concentrations were then adjusted to account for this endogenous amount. A dilution-QC at 10,200 ng/mL in plasma and a lower limit of quantitation (LLOQ) QC at 100 ng/mL in PBS were also prepared.
Calibration standards and the QC pools were aliquoted into pre-labeled 1.5-mL conical polypropylene vials (approximately 0.3-mL sample per vial) and stored at –20 °C or lower. These QC samples (both in PBS and plasma) were used for the entire method validation including short-term and long-term sample storage stability evaluation.
Sample preparation
For plasma samples, protein precipitation with methanol was used for sample preparation. Thawed samples were vortex-mixed well, and a 50.0 µL aliquot of each sample was transferred into small conical glass tubes. Both PBS blank and plasma blank were prepared. A 50.0-µL of the IS working solution (5.00 µg/mL) was added to the all samples except for double blanks and reagent blanks where the same volume of methanol-water (1:1, v/v) was added to make up the volume and composition. Then 500-µL of methanol was added to each tube, vortexed for 2 min, and centrifuged at approximately 3,000 rpm for 10 min. The supernatant was transferred into a clean round bottom glass tube containing 50-µL of keeper solution (ethylene glycol in 2-propanol), evaporated the extraction solvent under a stream of nitrogen at 45 °C using a water-bath for 25 mins. The residue was then reconstituted in 500-µL of methanol-water (1:1, v/v) by vortexing 2 min. A 10-µL aliquot of the resulted sample was injected for LC-MS/MS analysis.
Method validation
The validation protocol was established according to the food and drug administration (FDA) Bioanalytical Method Validation guidance for industry [29]. As D-serine is an endogenous biomarker in humans, there was no true negative (analyte-free) blank matrix available, so calibration standards were prepared in PBS buffer and QC samples were prepared in both PBS and human plasma, as described in previous section. During the validation, three analytical runs on three separate days were processed and analyzed for intra-run and inter-run precision and accuracy evaluation. Each run included duplicate sets of calibration standards, six replicates of each level non-dilution QC in PBS and in plasma including LLOQ QCs. One of the validation runs also included the dilution-QC samples for the examination of sample dilution integrity. In such analytical run, six replicates of dilution-QC samples (dilution factor of 5) and six replicates of mid-QC samples (dilution factor of 2.5) were also processed to demonstrate sample dilution linearity. The diluent used for dilution integrity evaluation was blank PBS solution as the blank plasma contained endogenous D-serine.
The short-term stability of the QC samples in both PBS and plasma were tested in one validation run, which included six freeze-thaw cycles from -20 °C to room temperature, and 36.5 h of room temperature (RT) sample stability. The extract stability and reinjection reproducibility were also evaluated. Extract stability of the QC samples was examined against a freshly prepared calibrator curve. Reinjection reproducibility was tested by re-injecting the entire run after a certain period of storage of extracts in the autosampler condition. Long-term frozen plasma QC sample storage stability was evaluated at multiple time points up to 769 days at both -20 °C and -70 °C. Whole blood processing stability was also assessed by fortifying fresh human whole blood with D-serine at low and high quality-control levels then storing for 0.5, 2 or 4 hours at room temperature or refrigerated condition (2 -8 °C) prior to isolating plasma.
Application
Human plasma samples were serially collected from a single ascending dose (SAD) first-in-human (healthy volunteers) study with the signed Inform Consent Form by each subject for an investigational compound SEP-227900. This clinical study consisted of 7 dose cohorts from 1 to 80 mg single oral dose. The study was placebo-controlled and each dose cohort enrolled 12 healthy male subjects (9 received the active treatment and 3 received placebo). Each enrolled subject had blood sampling from predose through 312 h postdose for pharmacokinetics (PK) and D-serine biomarker measurements. The PK analysis was based on the SEP-227900 plasma concentrations measured by a fully validated LC-MS/MS method. The plasma D-serine measurement as a biomarker for the DAAO inhibition was by a validated enantioselective LC-MS/MS method described in this paper. The urine samples were also collected from this study for both PK and D-serine analyses, but will not be discussed in this report.
Results and discussion
Method development
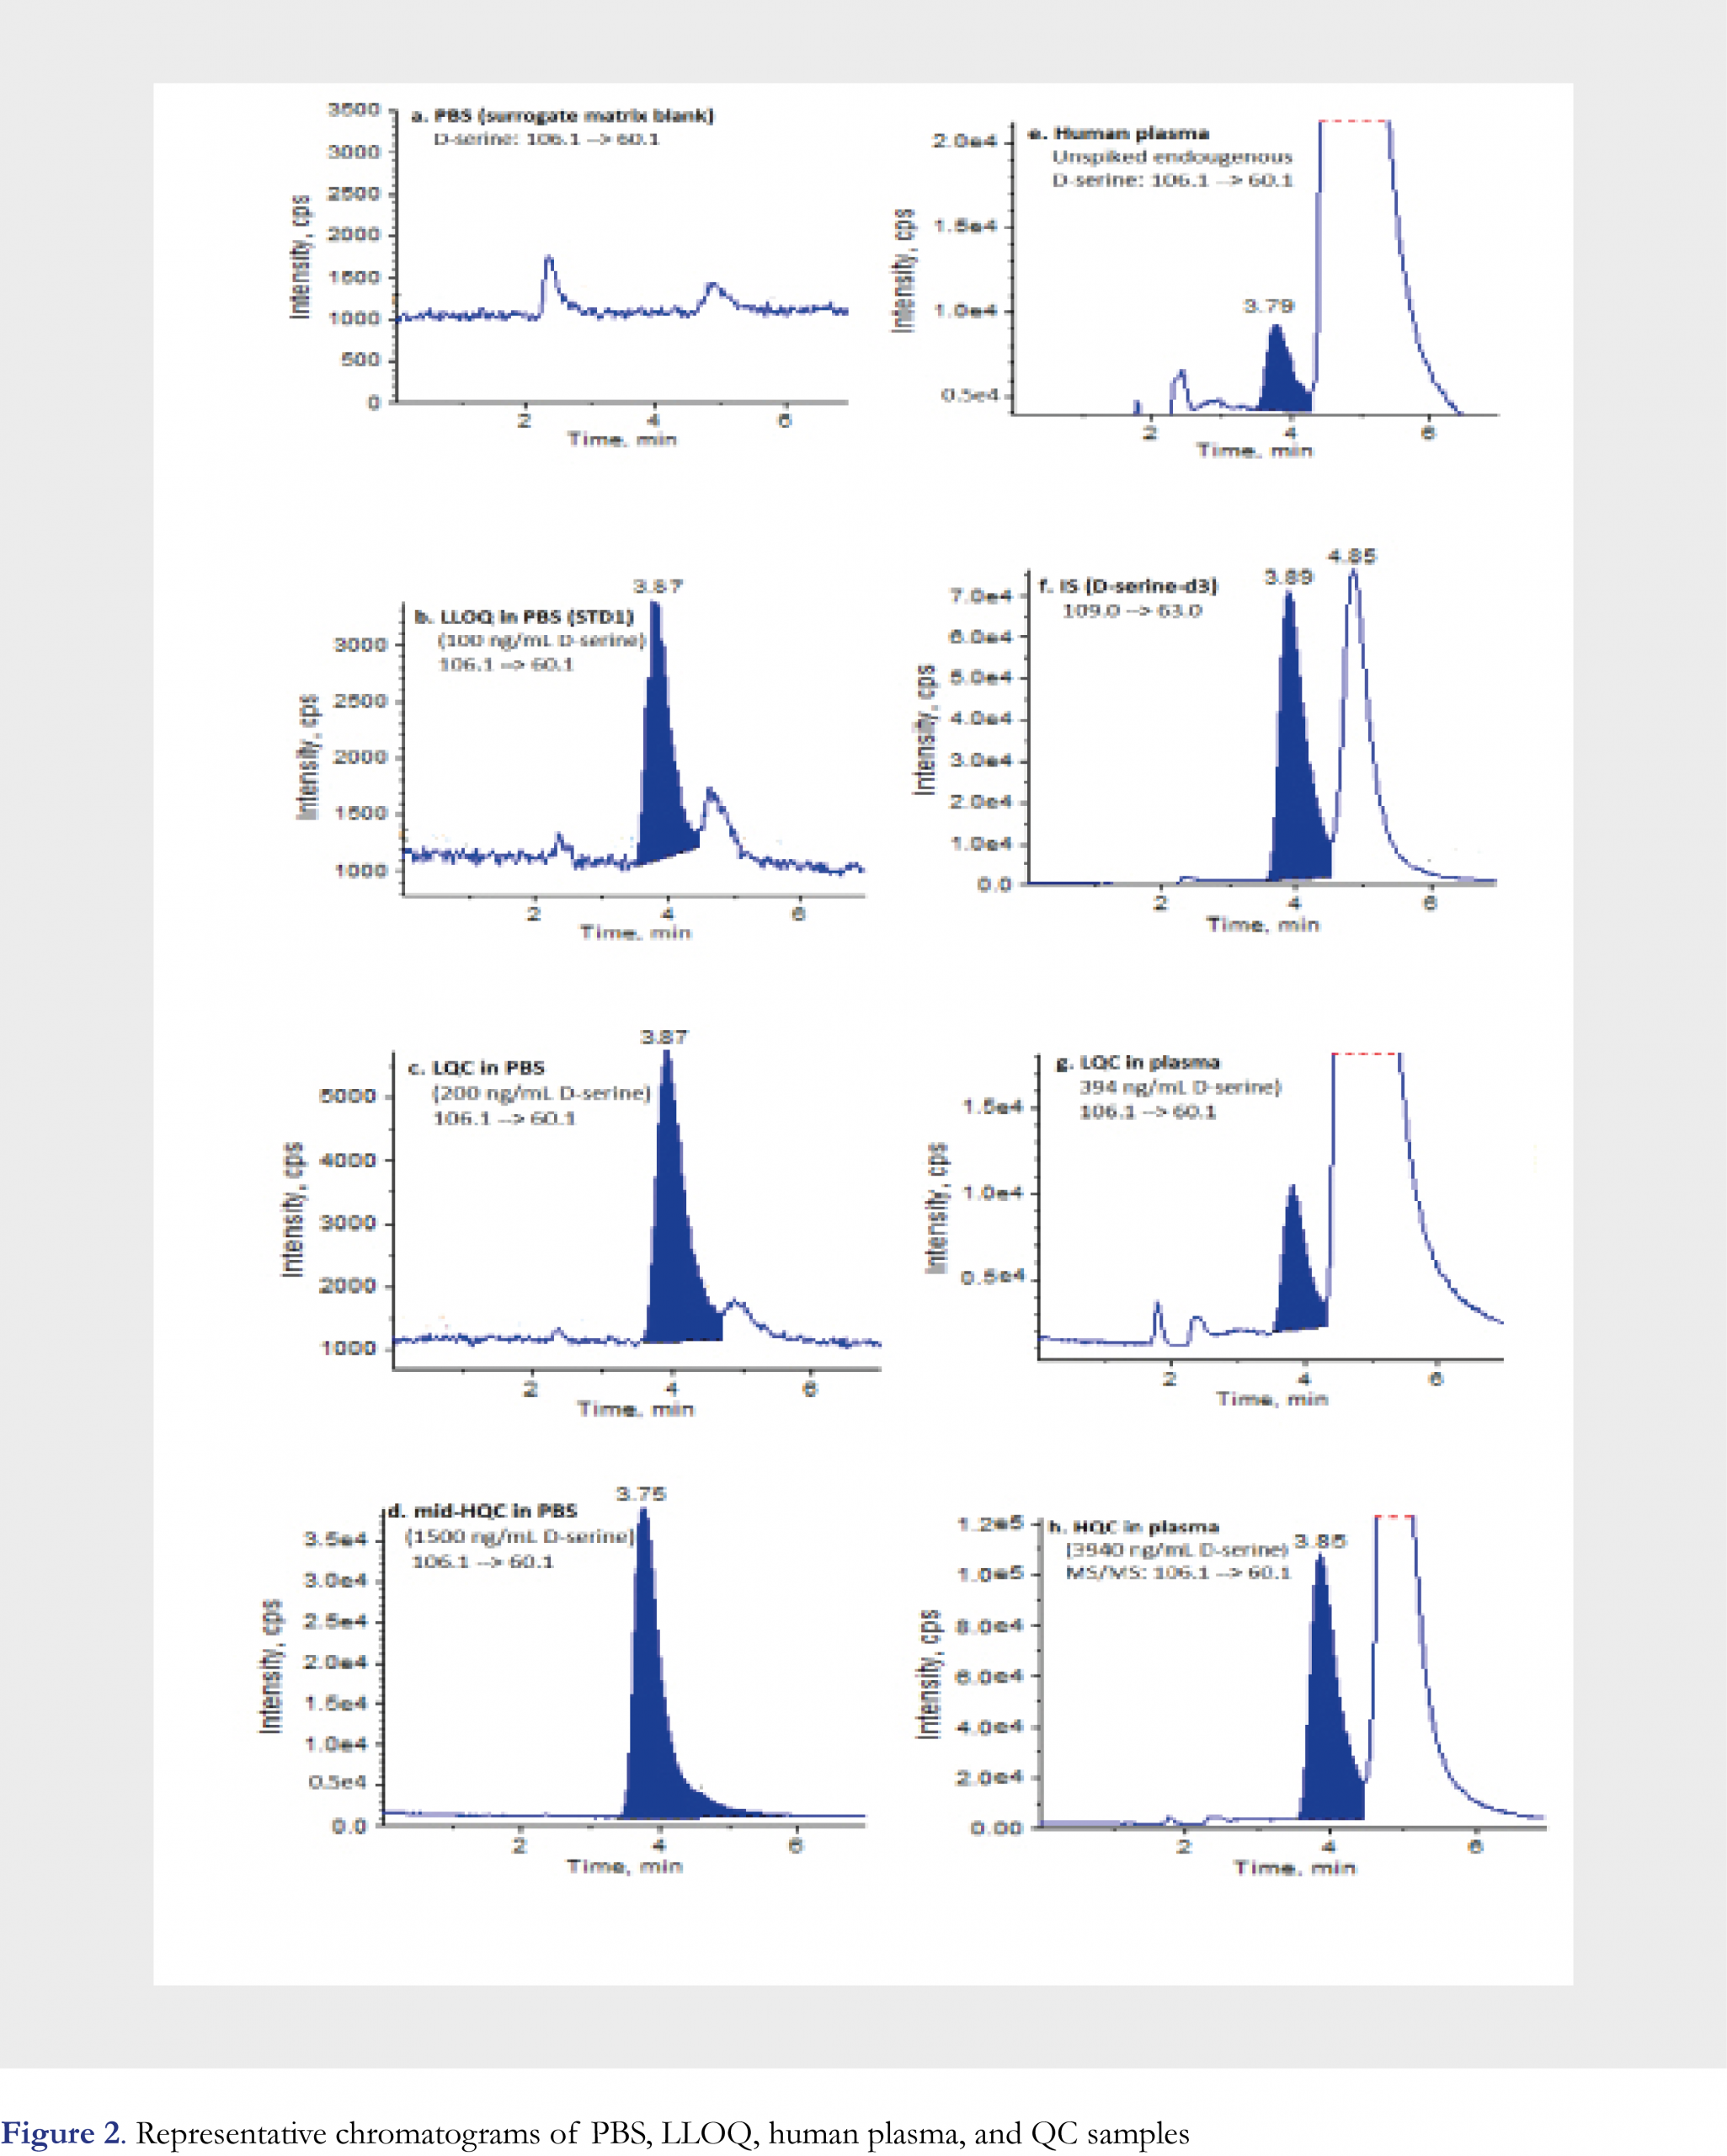
D-serine is an enantiomer of a chiral molecule serine (Figure 1a). To reliably quantify D-serine, an enantioselective baseline separation from L-serine is a must. To fulfill this goal, different chiral columns were screened and LC conditions were optimized during the method development. As a result, Regis® ChiroSil RCA (+) (150 × 4.6 mm, 5-µm) was selected as the analytical column and a mixture of 0.2% formic acid in water (Mobile Phase A)-0.2% formic acid in methanol (Mobile Phase B) at a ratio of 45:55 (v/v) was chosen as the mobile phase for the chromatographic separation. The method was validated under the above optimized conditions. As an often-seen phenomenon, the chiral stationary phase lot-to-lot variation may cause the retention time shifting even with the same manufacturer’s products, thus a re-adjusting and fine-tuning chromatographic conditions might be needed when a new column is used. In this study, the analyte retention time shifting due to column variability was also observed later when the method was applied to analyze clinical samples. An acceptable range of mobile phase composition from 45% to 55% of mobile phase B was determined to be effective in compensating for the retention time shift. Depending on the degree of adjustment, an additional partial validation experiment might be needed before the method was used for clinical sample analysis. D-serine is often seen only a small portion (~1-2%) of “total serine” in human plasma samples even lower in the schizophrenia patients [4], therefore a good chromatographic separation between D- and L- serine is extremely important. Moreover, the use of an enantioselective column that could retain L-serine longer than D-serine, i.e. D-serine be eluted first, is quite critical. As L-serine is a dominant enantiomer and its peak tailing, as long as L-serine is eluted after D-serine, would not interfere with D-serine peak measurement and quantitation. Under the optimized chromatographic conditions, D-serine had a retention time of ~3.8 min, and L-serine had a retention time of ~4.8 min, D- and L- enantiomers were nearly baseline separated from each other. Typical chromatograms are presented in Figure 2. To minimize the effect of L-enantiomer on the peak integration for D-serine, peak height ratios of the analyte/ the IS were recommended for generating calibration curve and for unknown calculation. If D- and L-serine peaks were well separated on column, then the use of peak area ratio for calculation was equally satisfactory with no significant difference from using peak height ratio.
Method validation
Specificity
Six lots of blank plasma were tested for the assay specificity. For each lot of plasma, plasma blank, plasma blank spiked with IS, plasma blank spiked with 200 ng/mL of D-serine were used to check interference and lot-to-lot matrix variation. For all six lots of blank plasma, no peaks were detected at the mass transition and retention time of the IS, indicating that (D,L)-serine-d3 could be used as the internal standard for D-serine measurement. The less abundant peak at the retention time of D-serine was attributable to the endogenous D-serine in human plasma. The drastically more abundant peak at the retention time of L-serine was confirming the observation of the typical serine’s enantio-distribution in human plasma. Endogenous D-serine in these six blank plasma samples without IS ranged from 2451 to 4835 counts with a mean of 3652 (CV 23.8% across 6 individual lots) by peak height. The endogenous amounts of D-serine in these plasma samples after spiked with IS were measured against the calibration curve using PBS as the surrogate matrix, and the found D-serine concentrations ranged from 115 to 234 ng/mL. For each of these six lots, the endogenous D-serine concentration was determined as the average concentration measured in six replicates of blank plasma spiked with IS. Across these tested blank plasma samples from six individuals, endogenous D-serine variation showed a CV of 24.5% with a mean concentration of 181 ng/mL. The measured values of the above six lots of blank plasma post-spiked 200 ng/mL D-serine showed a 90.3% recovery of “total D-serine” and a CV of 5.0%, indicating an acceptable assay specificity and matrix lot-to-lot variation. After the specificity evaluation, a larger plasma pool was created by combining multiple individual lots of blank plasma together and then measured in six replicates to obtain a mean endogenous concentration of 194 ng/mL D-serine. This plasma pool and its endogenous level of 194 ng/mL D-serine were used for the preparation of plasma QC samples in this method validation study and the clinical sample analysis presented in this manuscript. Representative chromatograms of the PBS blank, LLOQ (STD1) in PBS (100 ng/mL), Low QC in PBS (200 ng/mL), mid-High QC in PBS (1500 ng/mL) are shown in Figures 2a, 2b, 2c, and 2d, respectively. Representative chromatograms of the pooled “blank” human plasma (unspiked, but with endogenous D-serine level of 194 ng/mL), the IS, Low QC in plasma (endogenous + spiked = 394 ng/mL), High QC in plasma (endogenous + spiked = 3940 ng/mL) are shown in Figures 2e, 2f, 2g, and 2h, respectively. These chromatograms show that an acceptable enantiomeric separation was achieved, and this was also true for the incurred plasma samples with a relatively small peak of D-enantiomer.
Figures and Tables
[Click to enlarge]
Sensitivity, linearity, recovery and matrix effect
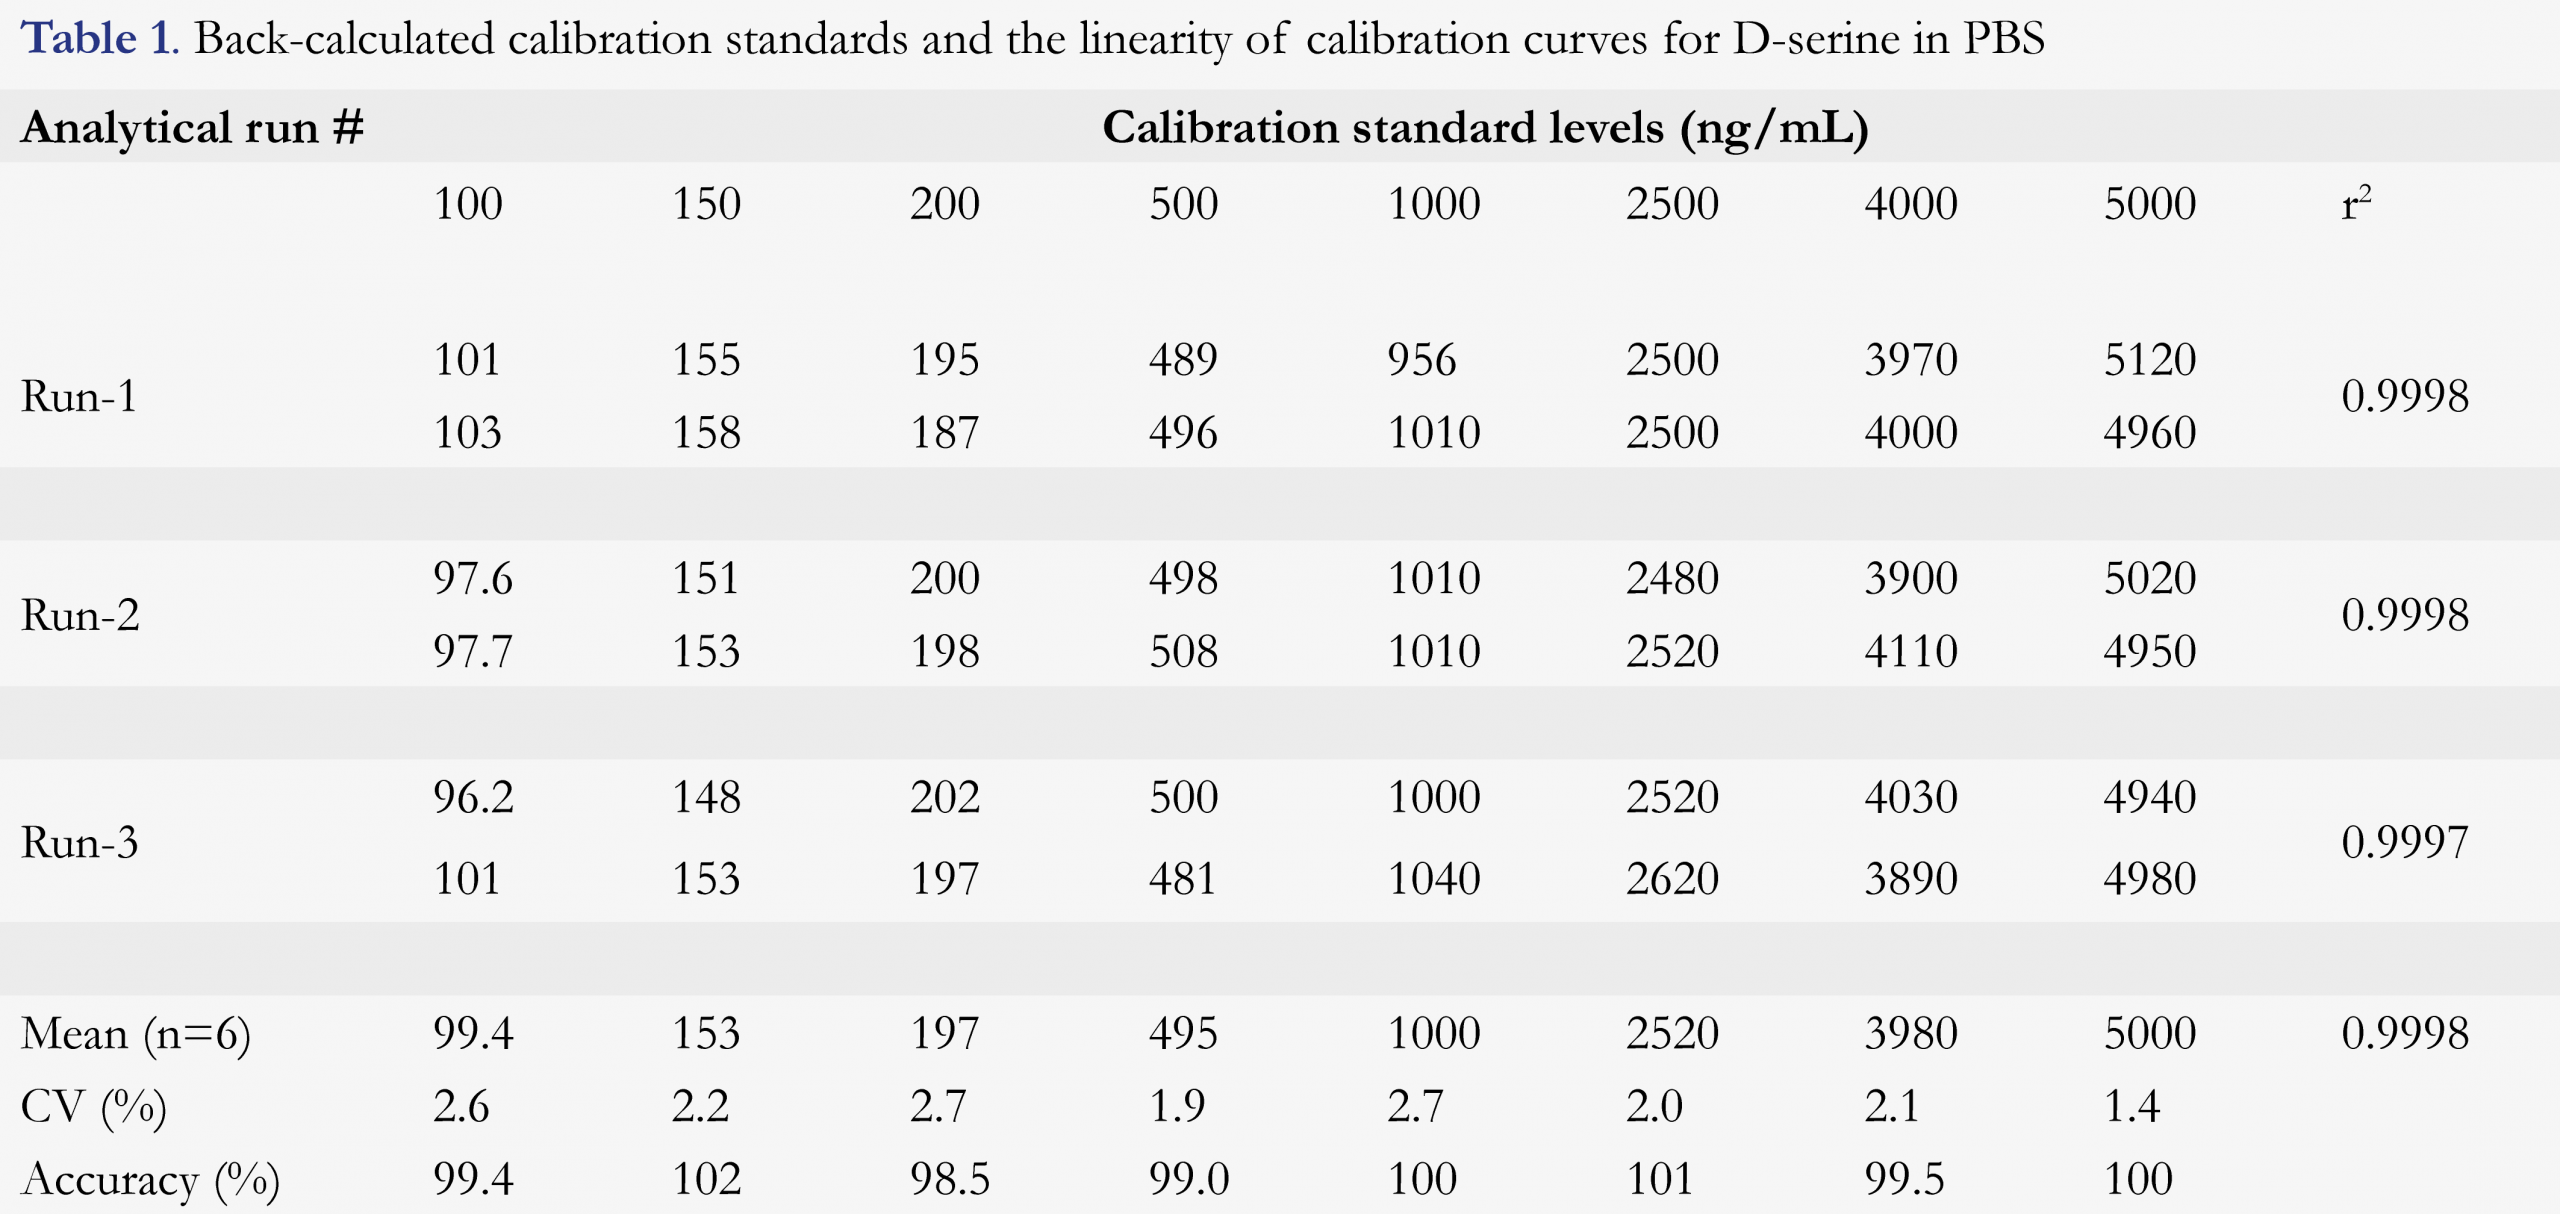
The calibration curve range was 100 to 5,000 ng/mL of D-serine using a 50-µL sample volume. The lowest non-zero concentration that could be quantitated accurately and reproducibly, i.e. LLOQ of this method, was validated as 100 ng/mL. As shown in Figure 2b, the signal-to-noise (S/N) ratio was quite high (estimated to be ~75) at the LLOQ of 100 ng/mL, if necessary, this method could be modified to have a significantly lower LLOQ, even down to low ng/mL level if baseline level could be effectively reduced. The LLOQ of 100 ng/mL in this method was sufficient to support clinical trials. This was set for fit-for-purpose, not the limitation of the method and technology used. The linearity of the method was established by eight calibration standards in duplicate over the nominal concentration range. A linear, 1/concentration weighted, least-squares regression algorithm was used to describe the relationship between the peak height ratio and nominal concentration. The linear correlation coefficient was ≥ 0.9997 for the three precision and accuracy runs during the method validation. Back-calculated values and reproducibility from each level of the calibration standards are presented in Table 1. Back-calculated results for all calibration standards (n = 6) were with coefficient of variation (CV) of better than 2.7% and the accuracy of 98.5 to 102% (i.e. relative error -1.5 to 2.0%), including the lowest standard point.
The extraction recovery of D-serine and the IS from human plasma and PBS were evaluated by comparing the average analyte peak height of pre-extraction spiked samples to the average analyte peak height of post-extraction spiked samples. The extraction recoveries from the PBS QC samples were found to be 88.8%, 87.5% and 99.0% for D-serine at low, medium and high concentrations, and 105% for the IS, respectively. The extraction recoveries from the plasma QC samples were found to be 84.1%, 78.4% and 76.4% for D-serine serine at low, medium and high concentrations, and 82.3% for the IS, respectively. These data showed that the method gave satisfactory extraction recovery from both plasma and PBS matrix.
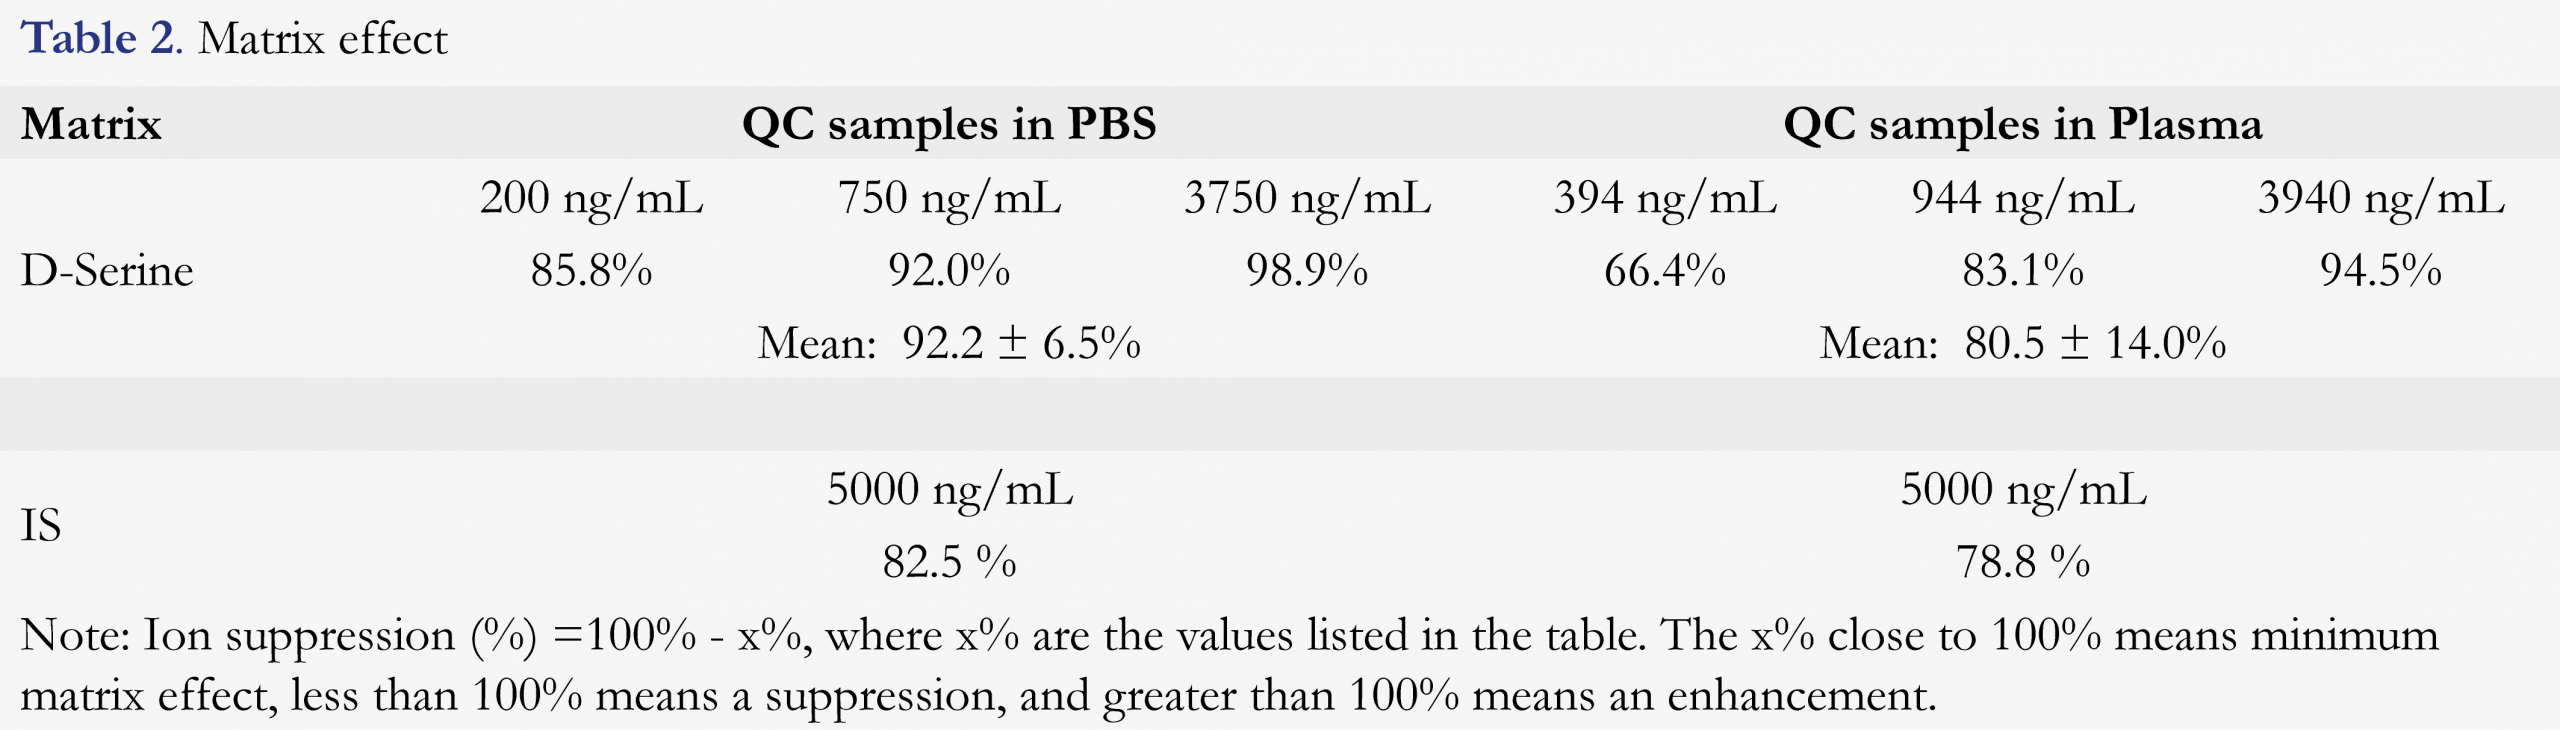
Matrix-related suppression or enhancement was evaluated by comparing the average analyte peak height of post-extraction spiked samples to the average analyte peak height of pure solutions (non-matrix prepared samples). The data are shown in Table 2 for PBS and human plasma. The matrix effect was 92.2 ± 6.5% for D-serine at low, medium and high QC concentrations in PBS, and 82.5% for IS, respectively. The matrix effect was 80.5 ± 14.0% for D-serine at low, medium and high QC concentrations in plasma, and 78.8% for IS, respectively. These data show that matrix suppressions in both PBS and plasma were between 10 – 20%, but this effect was compensated well by deuterated-label-internal standard. Therefore, the quantitation of D-serine with this method should be reliable.
Precision and accuracy of QC samples in PBS and in human plasma
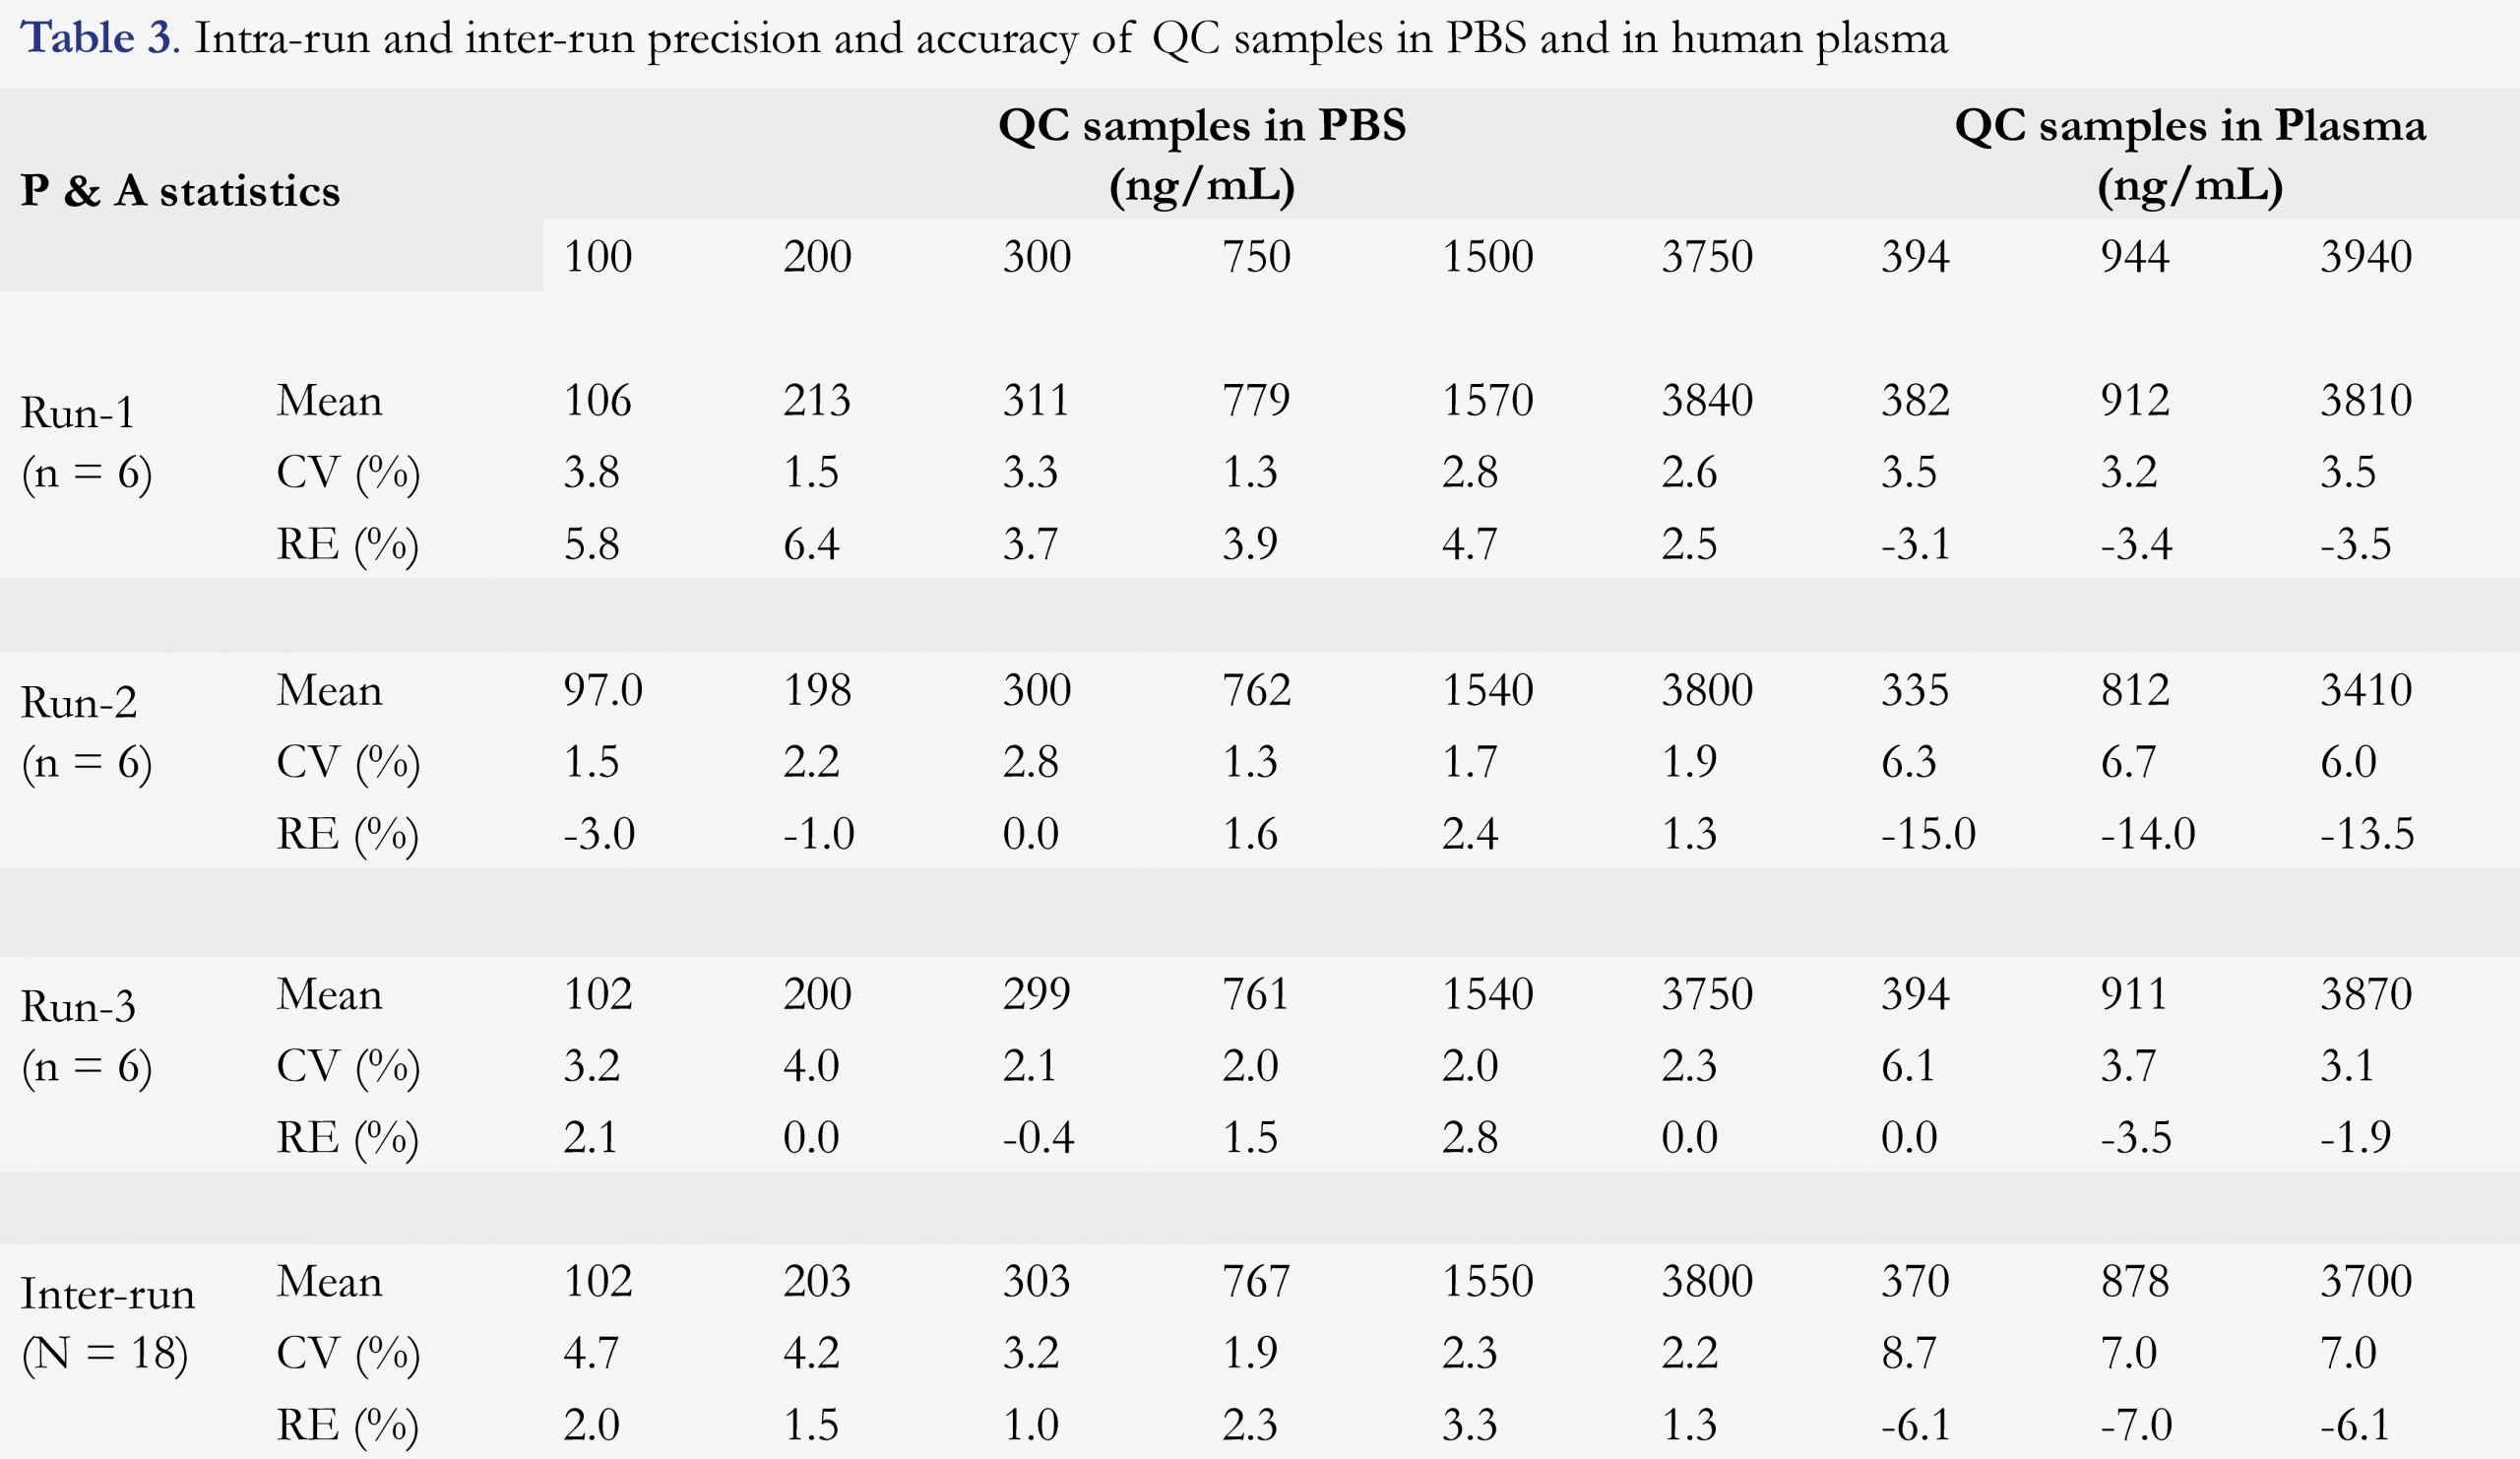
As summarized in the previous section, for all validation curves, the back-calculation results for all calibration standards showed ≤ 2.7% CV and -1.5 to 2.0% RE, respectively. The precision and accuracy for the QC samples are given in Table 3. For all QC levels (LLOQ, Low, mid-Low, Mid, mid-High, and High) in PBS, precision and accuracy were ≤ 4.0% CV and -3.0 to 6.4% RE for intra-run assays (n = 6), and ≤ 4.7% CV and 1.0 to 3.3% RE for inter-run assays (n = 18), respectively. For all QC levels (Low, Mid, and High) in plasma, precision and accuracy were ≤ 6.7% CV and -15.0 to 0.0% RE for intra-run assays (n = 6), and ≤ 8.7% CV and -7.0 to -6.1% RE for inter-run assays (n = 18), respectively.
These results demonstrated good precision and accuracy of the proposed method for the determination of D-serine in both PBS and plasma matrices, even at the lower end of the quantitation dynamic range. This also indicated that PBS could be utilized as a surrogate matrix for the quantitation of D-serine in human plasma especially when a stable isotope-labeled analyte was used as the internal standard.
Dilution integrity, short-term and long-term sample storage stability
A 5-fold dilution for over-the-curve QC sample by PBS prior to extraction was used to evaluate sample dilution integrity. Six replicates of partial volume of Mid QC plasma samples with a 2.5-fold pre-dilution were also processed in a validation batch. Data (not shown) are acceptable with 3.3% CV and -6.3% RE for the 5-fold diluted over-the-curve QC in plasma, and 7.0% CV and -0.6% RE for the Mid QC with 2.5-fold dilution by PBS, respectively. The results indicated that taking partial volume and diluting plasma with PBS by up to 5-fold did not produce significant deviation from their nominal values.
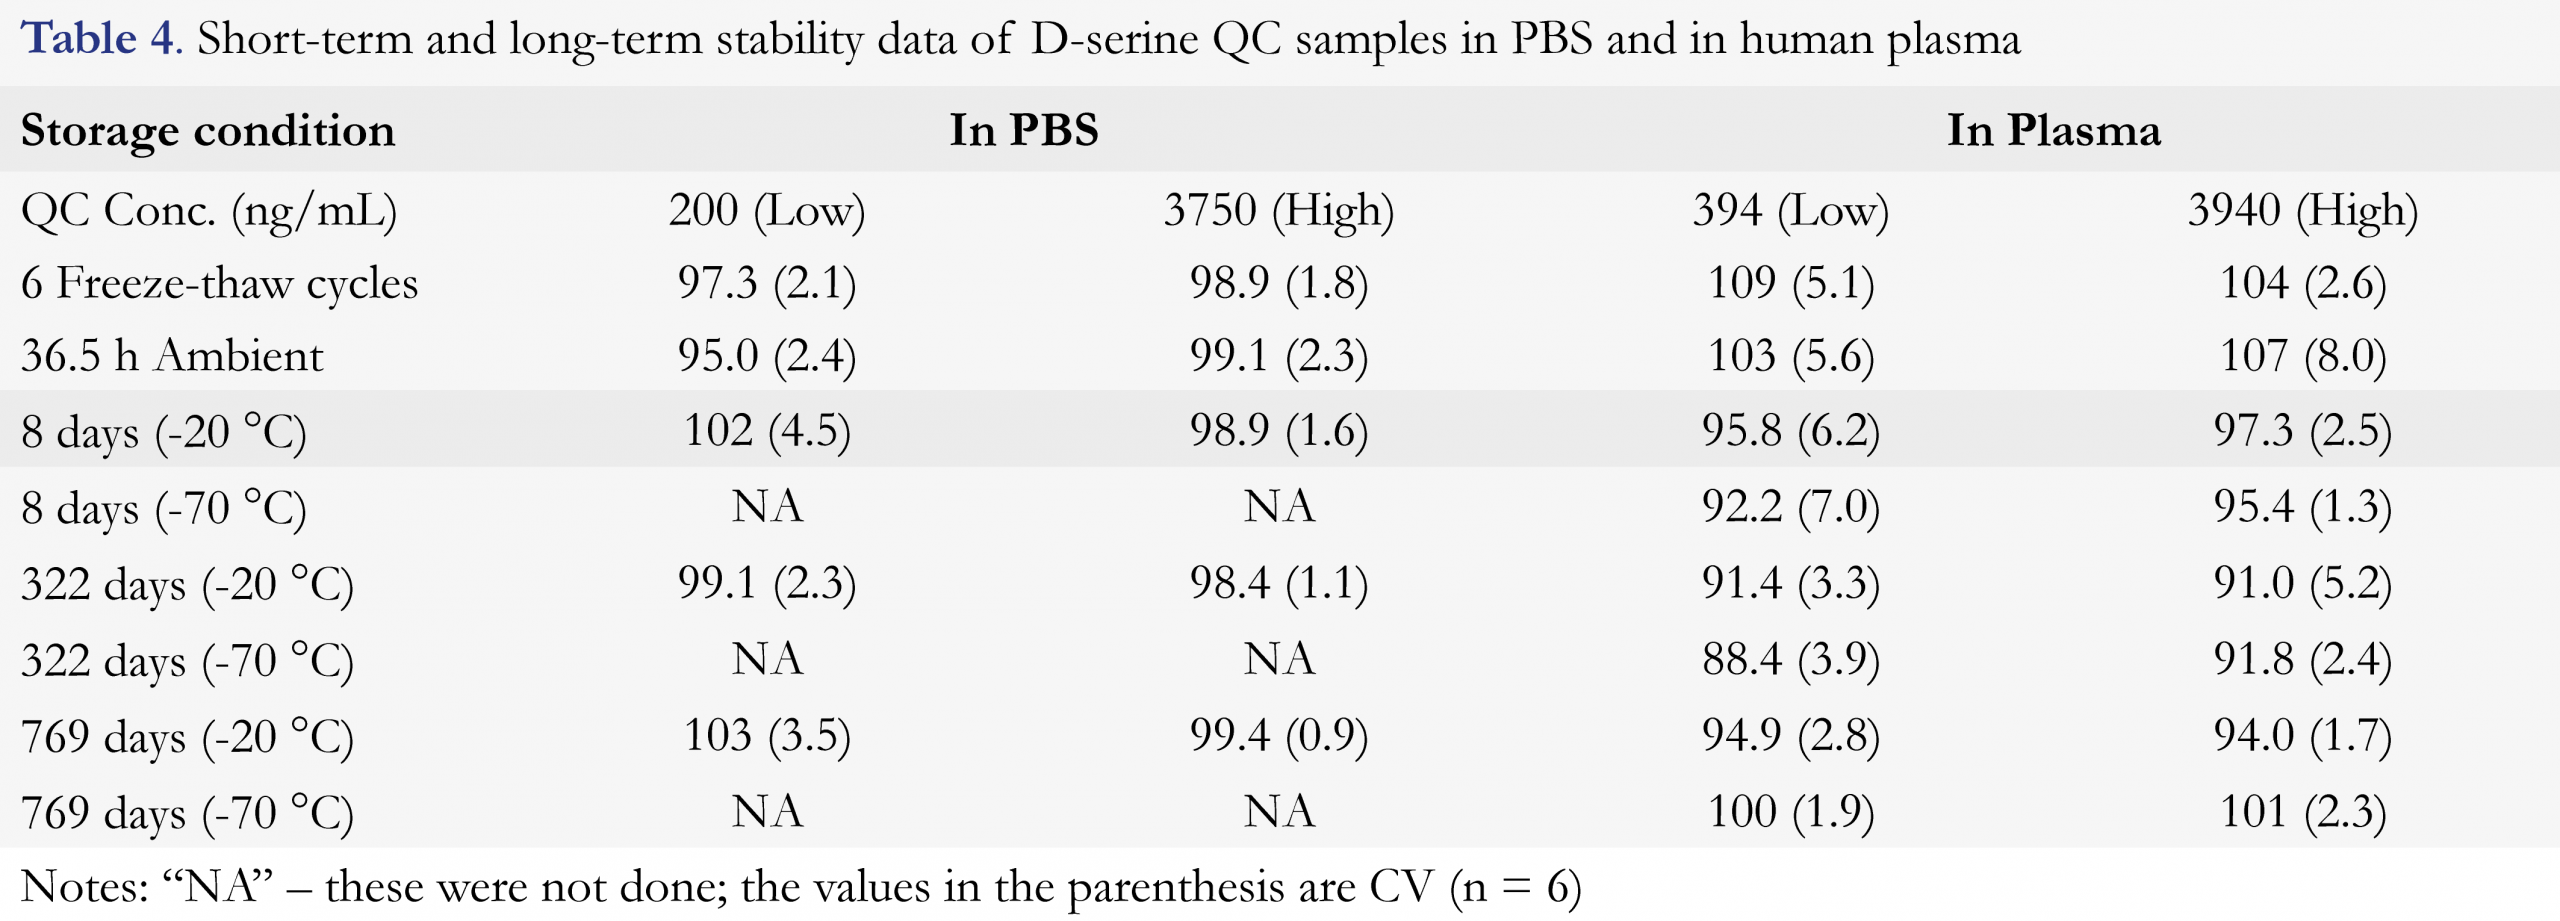
The short-term QC sample stability such as freeze-thaw and room temperature (RT) stability tests were performed as described, the results are summarized in Table 4. The QC samples undergoing six freeze-thaw cycles gave ≤ 2.1% CV and an accuracy of 97.3 – 98.9% in PBS, and ≤ 5.1% CV and an accuracy of 104 – 109% in plasma. The samples having been stored at room temperature (RT) for 36.5 h prior to extraction gave ≤ 2.4% CV and an accuracy of 95.0 – 99.1% in PBS, and ≤ 8.0% CV and an accuracy of 103 – 107% in plasma. It was also confirmed that the extracts from both PBS QC samples and plasma QC samples were stable for up to 149 h when they were kept at 5 °C (data not shown), thus extracted samples could be injected or re-injected within this established stability period.
The long-term frozen storage stability of the QC samples in plasma stored at -20 °C and -70 °C and the QC samples in PBS stored at -20 °C have also been tested and the data are included in Table 4 as well. The results of the 8-day-old samples showed less than 7.0% CV (n = 6) and an accuracy of 92.2 – 102%, the results of the 322-day-old samples showed less than 5.2% CV (n = 6) and an accuracy of 88.4 – 99.1%, and the results of the 769-day-old samples showed less than 3.5% CV (n = 6) and an accuracy of 94.0 – 103%. These data illustrated that the plasma samples were stable for up to 769 days if they were stored frozen at -20 °C and -70 °C.
D-serine stability in K2EDTA whole blood was also evaluated at Low and High quality control levels under both refrigerated and room temperature conditions. The whole blood samples being stored at room temperature for 4 hours showed a difference of 0.5 – 2.4% from the time zero control. The whole blood samples stored at 2 – 8 °C for 4 hours showed a difference of 0.0 – 1.2% from the time zero control. The above evaluation (data not shown) demonstrated that D-serine was stable in human whole blood for a period of 4 hours at either room temperature or refrigerated conditions. This should provide a grace period for clinical blood collection and processing to plasma for the reliable measurement of plasma D-serine levels.
Application to a Phase I Study
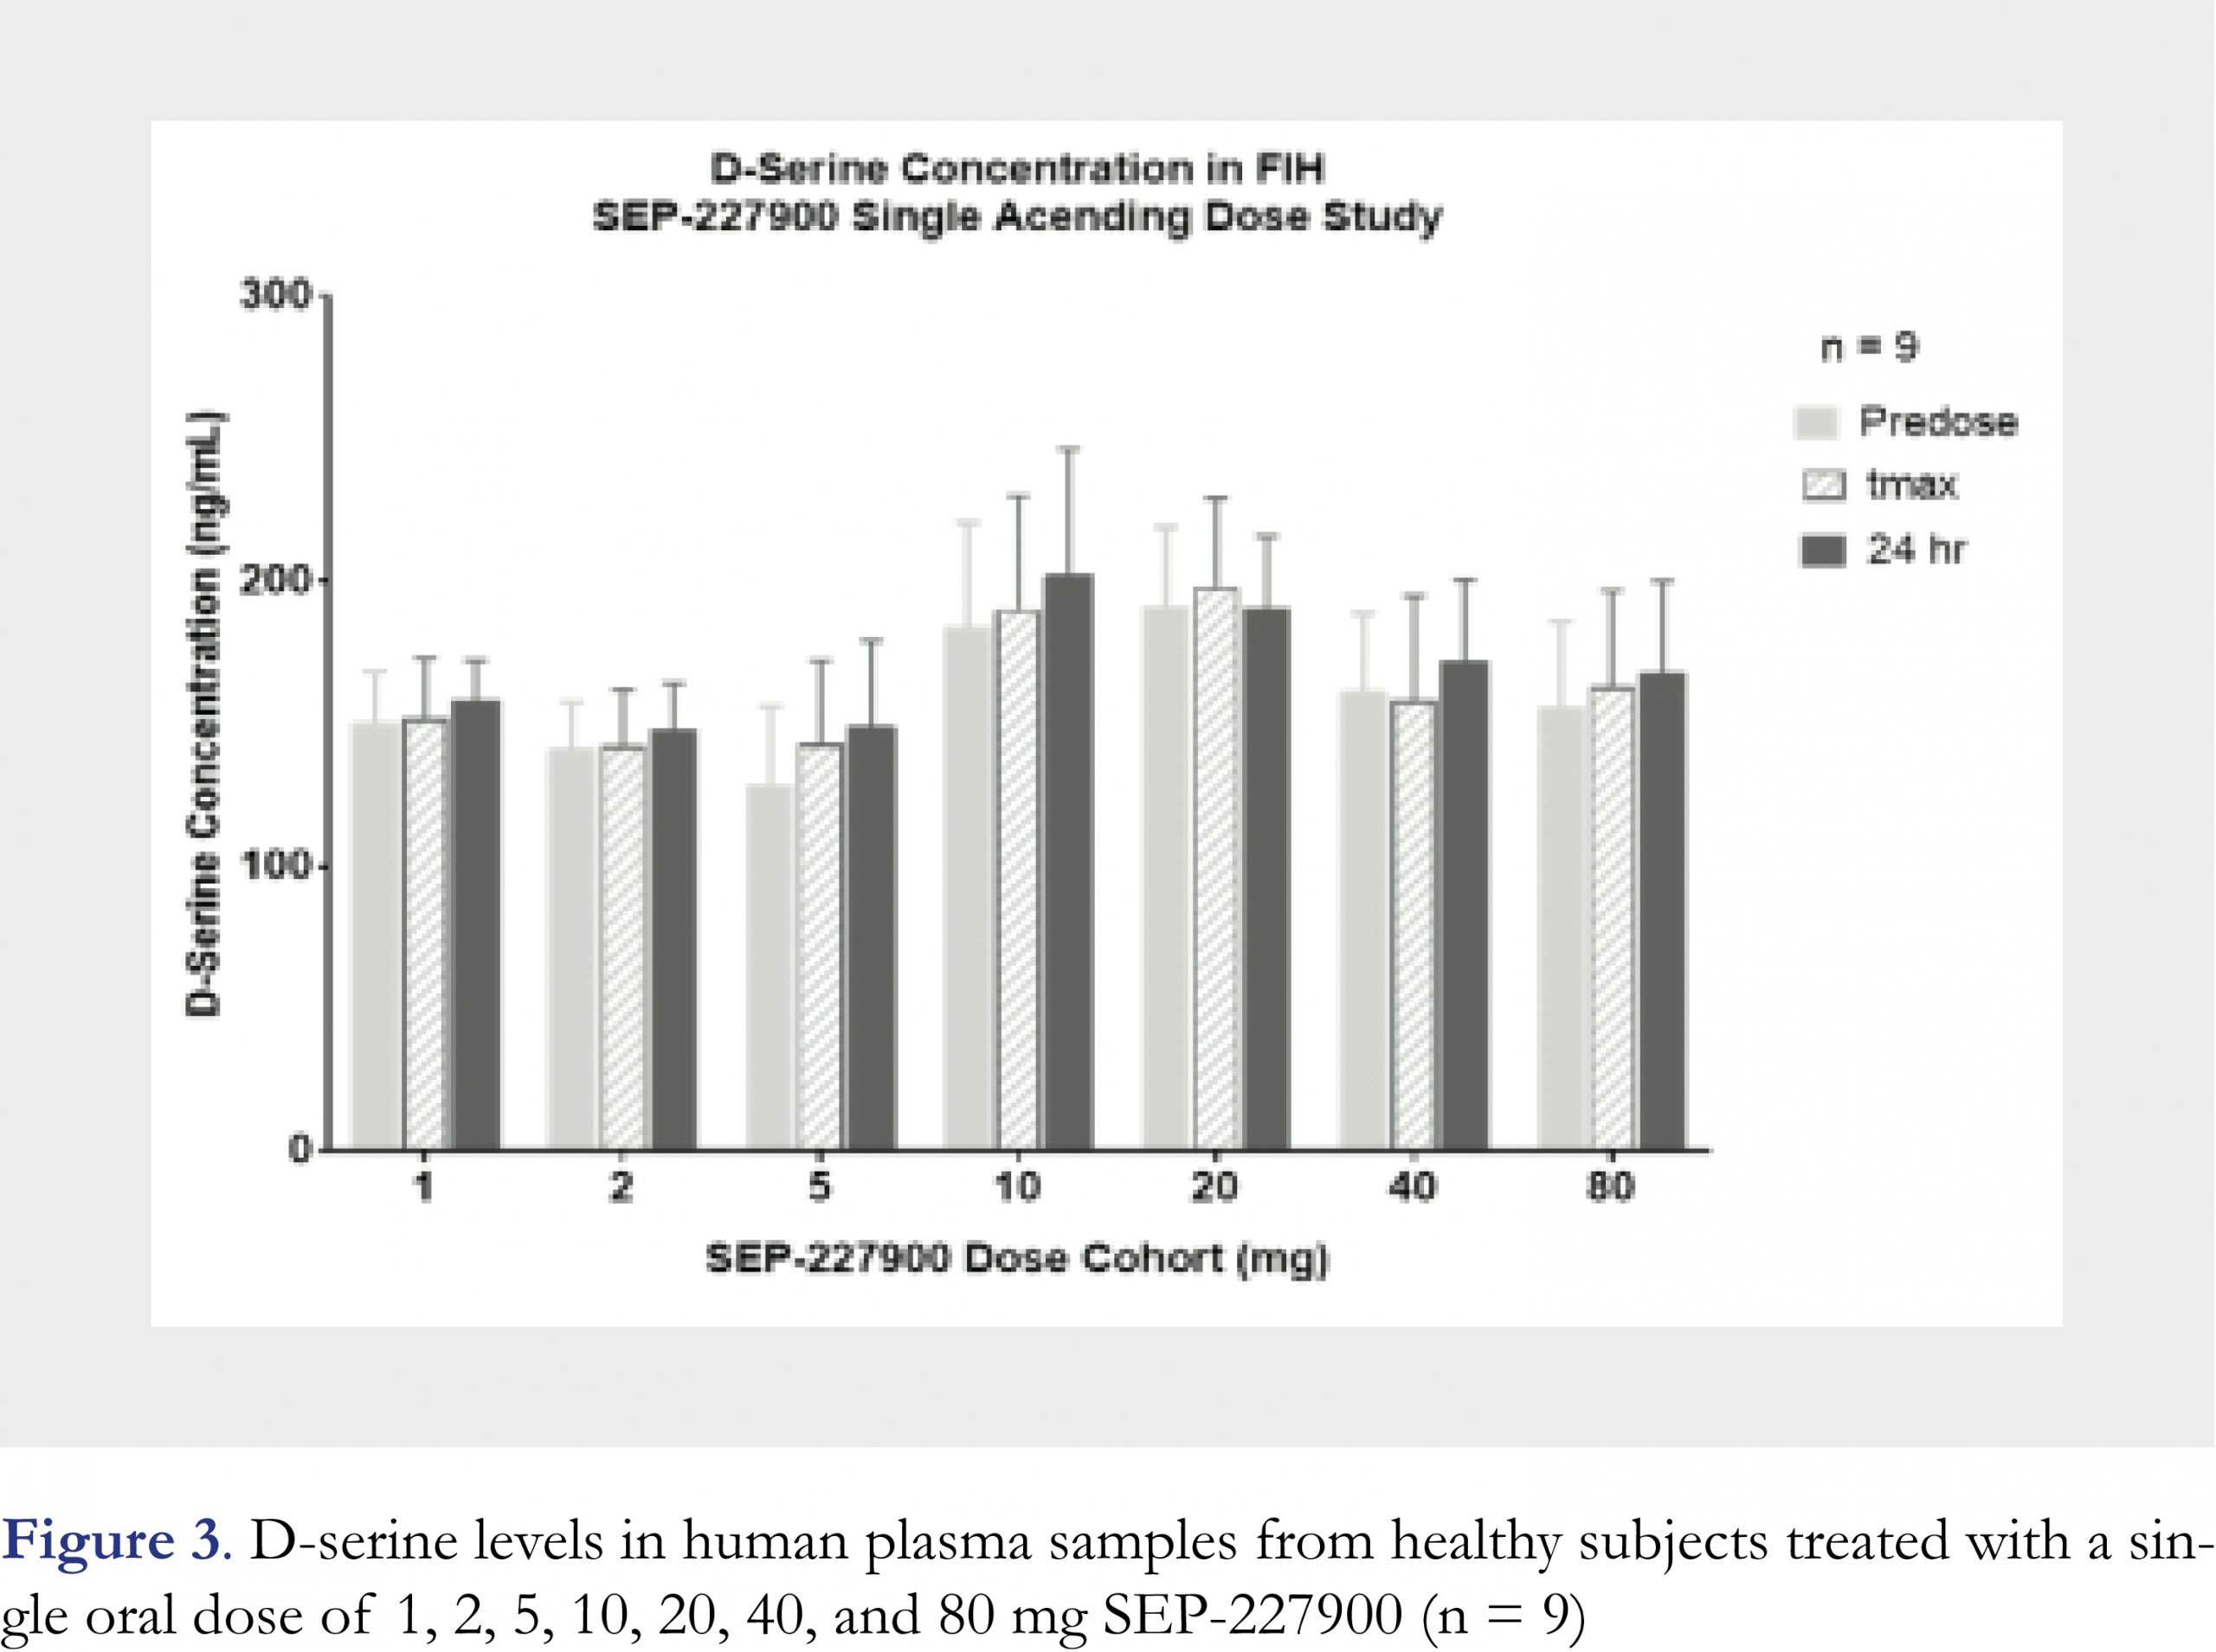
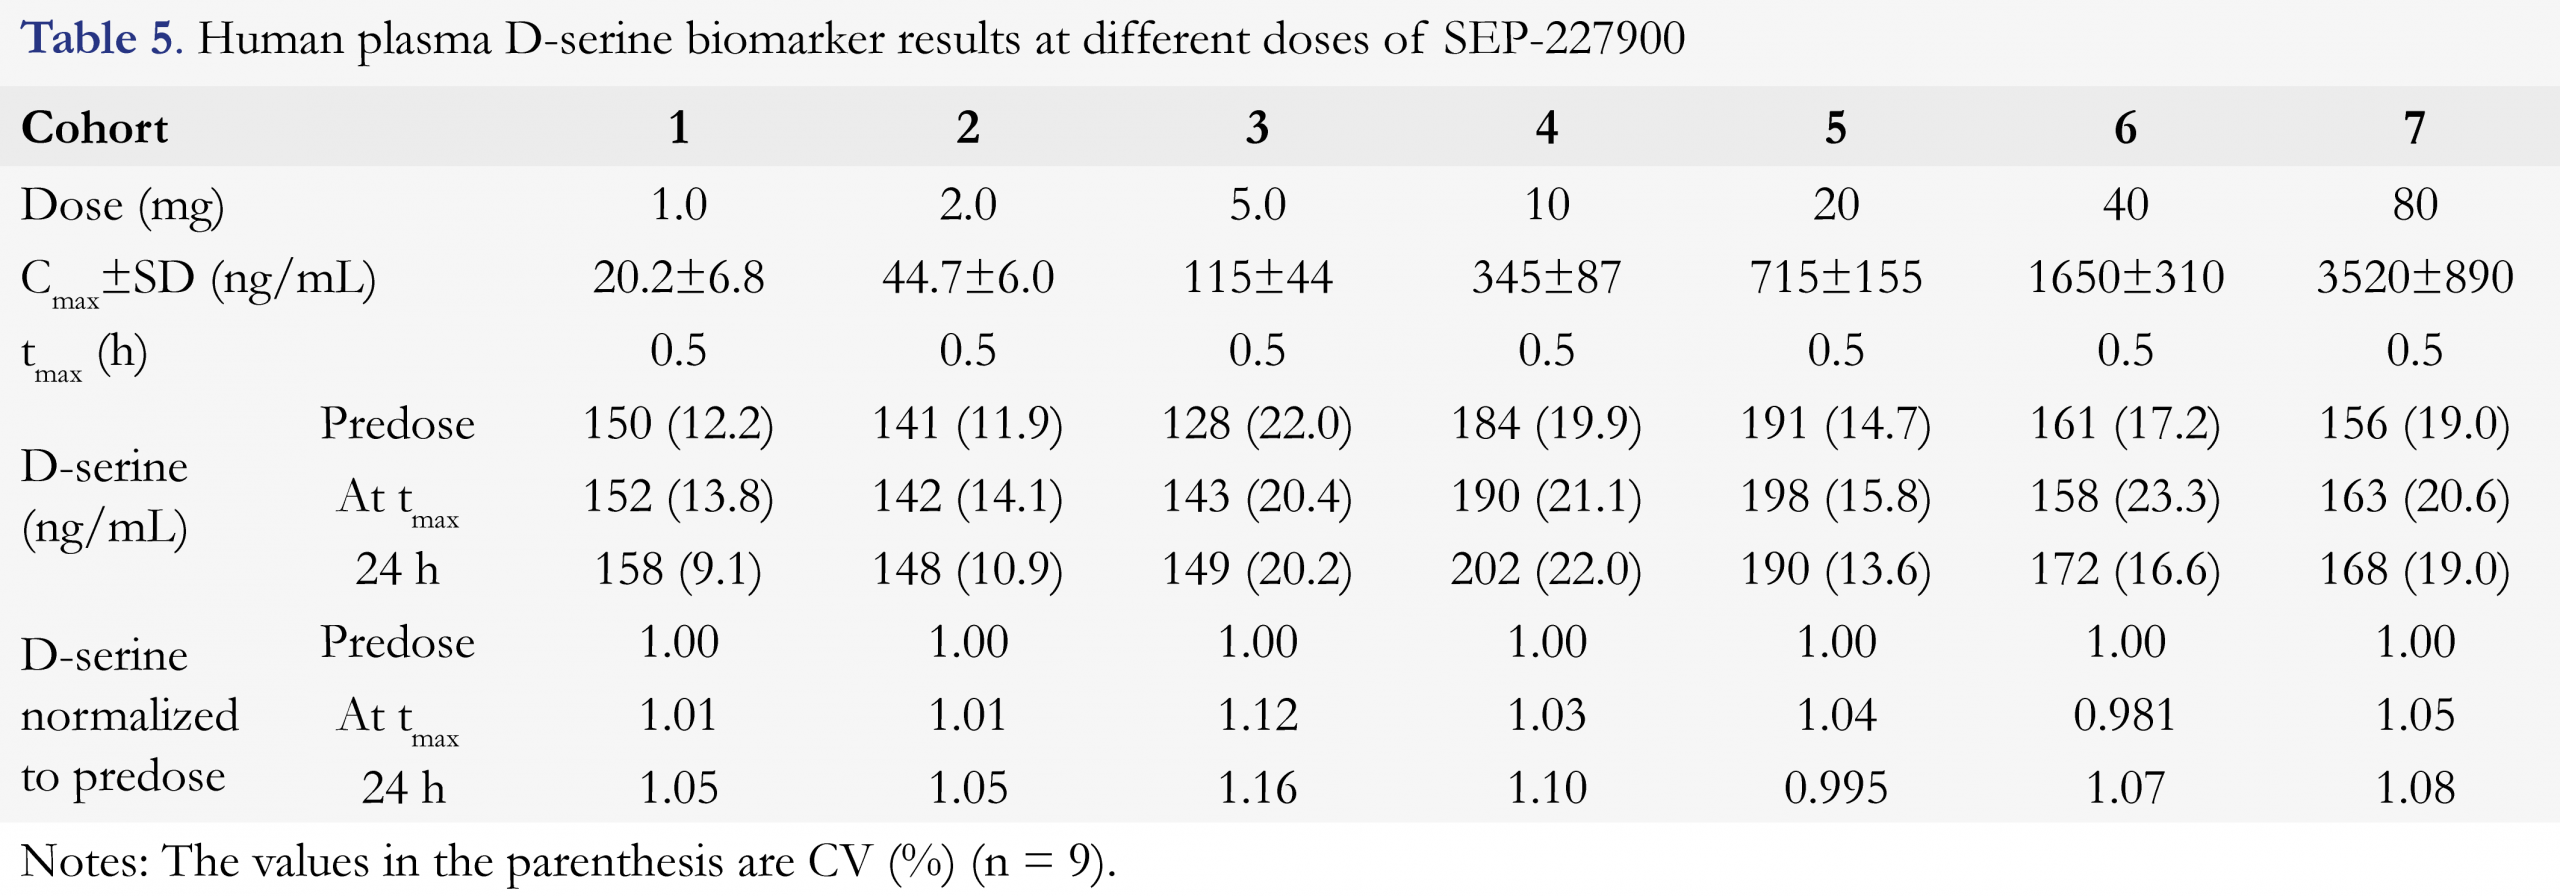
The above validated method has been successfully applied to analyze over 2200 plasma samples from a Phase I clinical study of SEP-227900. The study was a placebo-controlled single ascending dose (SAD) through oral administration. A total of seven cohorts (seven doses were 1, 2, 5, 10, 20, 40, and 80 mg) were clinically conducted in healthy male subjects. Predose plasma samples and the 24 h postdose plasma samples collected from all cohorts and all treatments were confirmed to be below the lower limit of quantitation for SEP-227900 (LLOQ was 0.050 ng/mL). The drug plasma concentrations were measured by a validated LC-MS/MS method. The mean Cmax of SEP-227900 at each dose level was presented in Table 5. The tmax of SEP-227900 was typically 0.5 h across the dose range. The measured D-serine mean concentrations at each of predose, tmax and trough (24 h postdose) for each cohort, and normalized D-serine level (to predose) are also presented in Table 5, and D-serine results are graphically shown in Figure 3. The typical chromatogram of an incurred study sample was very similar to the blank plasma with endogenous D-serine, as shown in Figure 2e. To confirm the method reproducibility, 221 plasma samples, approximately ten percent (10%) of total number of plasma samples across 7 cohorts, were selected for incurred sample reassy (ISR) evaluation. An over 87% of the ISR plasma samples (193/221) had repeating and original results agreed within 20% of each other, demonstrating satisfactory assay performance for this newly validated method. As SEP-227900 was considered as a potential competitive inhibitor of DAAO, so D-serine level in humans was expected to be elevated with the treatment of this agent. However as summarized in Table 5, the plasma D-serine levels in the above SAD clinical study had no significant change from predose to tmax (at the peak concentration of the dosed compound) and 24 h post-dose, and from placebo to active treatments across the dose range used in this clinical trial. The normalized to predose D-serine level at all cohorts conducted had a value from 0.981 to 1.16. Although the Cmax of SEP-227900 in plasma was increased from 20.2 ng/mL at 1 mg dose to 3520 ng/mL at 80 mg dose, normalized D-serine remained the same. The insignificant D-serine change as an outcome of the biomarker monitoring in this clinical study was very helpful to making “no-go” decision for the development of this investigational compound [30].
Conclusions
This paper presented the development and validation of a simple and robust enantioselective LC-MS/MS method for direct quantitative determination of D-serine in human plasma. To the best of our knowledge, this is the first direct and rapid quantitative analysis of D-serine in human plasma without a complex chemical derivatization step. The PBS buffer was proven to be a good choice as a surrogated matrix for the preparation of calibration standards. The quality control samples were prepared in both PBS and real matrix (plasma) for the method validation. The method validation was completed sometime before the new FDA guidance on Bioanalytical Method Validation was issued and part of the results was presented as a conference poster [31], but the validation design and entire procedure including the use of surrogate matrix for calibration standards and plasma matrix for quality control samples were well in line with the newly issued FDA guidance [29] where endogenous analytes and biomarker assays were specifically described. This method has been demonstrated to be reliable through validation and its successful application to a clinical Phase I study with acceptable incurred sample reanalysis reproducibility. This work demonstrated that the use of surrogate matrix standard curve and real matrix quality control (QC) samples could be considered as a feasible approach for endogenous biomarker monitoring in biomedical research and drug development.
Acknowledgment
This study was fully sponsored by Sunovion Pharmaceuticals, Inc. The authors are grateful to Julie Diancin and Lisa Kinning at the PPD bioanalytical Lab (Middleton, WI) for managing this study including the measurement of human plasma D-serine levels.
References
1. Nishikawa T. Analysis of free D-serine in mammals and its biological relevance, J Chromatogr B 879, 3169-3183 (2011). [CrossRef]
2. Hamase K, Morikawa A, Zaitsu K. D-amino acids in mammals and their diagnostic value, J Chromatogr B 781, 73-91 (2002). [CrossRef]
3. Kirschner DL, Green TK. Separation and sensitive detection of D-Amino acids in biological matrices. J Sep Sci 32, 2305-2318 (2009). [CrossRef]
4. Hashimoto K, Fukushima T, Shimizu E et al. Decreased serum levels of D-serine in patients with schizophrenia. Arch Gen Psychiatry 60, 572-576 (2003). [CrossRef]
5. Smith SM, Uslaner JM, Hutson PH. The therapeutic potential of D-amino acid oxidase (DAAO) inhibitors. The Open Med Chem J 4, 3-9 (2010). [CrossRef]
6. Guercio GD, Bevictori L, Vargas-Lopes C et al. D-serine prevents cognitive deficits induced by acute stress. Neuropharmacol 86, 1-8 (2014). [CrossRef]
7. Fuchs SA, Berger R, de Koning TJ. D-Serine: The right or wrong isoform? Brain Res 1401, 104-117 (2011). [CrossRef]
8. Ito T, Takahashi K, Naka T, Hemmi H, Yoshimura T. Enzymatic assay of D-serine using D-serine dehydratase from Saccharomyces cerevisiae. Anal Biochem 371, 167-172 (2007). [CrossRef]
9. Radzishevsky I, Wolosker H. An enzymatic-HPLC assay to monitor endogenous D-serine release from neuronal cultures. Methods Mol Biol 794, 291-297 (2012). [CrossRef]
10. Zhao S, Yuan H, Xiao D. Detection of D-serine in rat brain by capillary electrophoresis with laser induced fluorescence detection. J Chromatogr B 822, 334-338 (2005). [CrossRef]
11. Zhao S, Song Y, Liu Y. A novel capillary electrophoresis method for the determination of D-serine in neural samples. Talanta 67, 212-216 (2005). [CrossRef]
12. Li S, Yu Q, Lu X, Zhao S. Determination of D, L-serine in midbrain of Parkinson’s disease mouse by capillary electrophoresis with in-column light-emitting diode induced fluorescence detection. J Sep Sci 32, 282-287 (2009). [CrossRef]
13. Kirschner DL, Jaramillo M, Green TK. Enantioseparation and stacking of Cyanobenz[f]isoindole-amino acids by reverse polarity capillary electrophoresis and sulfated cyclodextrin. Anal Chem 79, 736-743 (2007). [CrossRef]
14. Singh NS, Paul RK, Sichler M, Moaddel R, Bernier M, Wainer IW. Capillary electrophoresis-laser induced fluorescence (CE-LIF) assay for measurement of intracellular D-serine and serine racemase activity. Anal Biochem 421, 460-466 (2012). [CrossRef]
15. Hasegawa H, Shinohara Y, Masuda N, Hashimoto T, Ichida K. Simultaneous determination of serine enantiomers in plasma using Mosher’s reagent and stable isotope dilution gas chromatography-mass spectrometry. J Mass Spectrum 46, 502-507 (2011). [CrossRef]
16. Miyoshi Y, Hamase K, Okamura T, Konno R, Kasai N, Tojo Y, Zaitsu K. Simultaneous two-dimensional HPLC determination of free D-serine and D-alanine in the brain and periphery of mutant rats lacking D-amino-acid oxidase. J Chromatogr B 879, 3184-3189, (2011). [CrossRef]
17. Song Y, Feng Y, LeBlanc MH, Zhao S, Liu YM. Assay of trace D-amino acids in neutral tissue samples by capillary liquid chromatography/tandem mass spectrometry. Anal Chem 78, 8121-8128 (2006). [CrossRef]
18. Fukushima T, Kawai J, Imai K, Toyooka T. Simultaneous determination of D- and L-serine in rat brain microdialysis sample using a column-switching HPLC with fluorimetric detection. Biomed Chromatogr 18, 813-819 (2004). [CrossRef]
19. Grant SL, Shulman Y, Tibbo P, Hampson DR, Baker GB. Determination of D-serine and related neuroactive amino acids in human plasma by high-performance liquid chromatography with fluorimetric detection, J Chromatogr B 844, 278-282 (2006). [CrossRef]
20. Kim TY, Kim HJ. Chiral separation of 9-fluorenylmethyl chloroformate- and dansyl chloride-derivatized D, L-serine by γ-cyclodextrin-boned high performance liquid chromatography. J Chromatogr A 933, 99-106 (2001). [CrossRef]
21. Visser WF, Verhoeven-Duif M, Ophoff R, Bakker S, Klomp LW, Berger R, de Koning TJ. A sensitive and simple ultra-high-performance-liquid chromatography-tandem mass spectrometry-based method for the quantification of D-amino acids in body fluids. J Chromatogr A 1218, 7130-7136 (2011). [CrossRef]
22. Berna MJ, Achermann BL. Quantification of serine enantiomers in rat brain microdialysate using Marfey’s Reagent and LC/MS/MS. J Chromatogr B 846, 359-363 (2007). [CrossRef]
23. Hashimoto A, Nishikawa T, Oka T, Takahashi K, Hayashi T. Determination of free amino acid enantiomers in rat brain and serum by high performance liquid chromatography after derivatization with N-tert-butyloxycarbonyl-L-cysteine and o-phthaldialdehyde. J Chromatogr 582, 41-48 (1992). [CrossRef]
24. Sethuraman R, Krishnamoorthy MG, Lee T et al. Simultaneous analysis of D- and L-serine in cerebrospinal fluid by use of HPLC. Clin Chem 53(8), 1489-1494 (2007). [CrossRef]
25. Xie Y, Alexander GM, Schwartzman RJ et al. Development and validation of a sensitive LC-MS/MS method for the determination of D-serine in human plasma. J Pharm Biomed Anal 89, 1-5 (2014). [CrossRef]
26. Kinoshita K, Jingu S, Yamaguchi J. A surrogate analyte method to determine D-serine in mouse brain using liquid chromatography-tandem mass spectrometry. Anal Biochem 432 , 124-130 (2013). [CrossRef]
27. Bhushan R, Brukner H. Use of Marfey’s reagent and analogs for chiral amino acid analysis: Assessment and applications to natural products and biological systems. J Chromatogr B 879, 3148-3161 (2011). [CrossRef]
28. Lu JM, Gong N, Wang YC, Wang YX. D-amino acid oxidase-mediated increase in spinal hydrogen peroxide is mainly responsible for formalin-induced tonic pain. British J. Pharmacol 165, 1941-1955 (2012). [CrossRef]
29. Food and Drug Administration of the United States, Guidance for Industry-Bioanalytical Method Validation, U.S. Department of Health and Human Services, Center for Drug Evaluation and Research (CDER), Center for Veterinary Medicine (CVM), May 2018. [Available from http://www.fda.gov/Drugs/GuidanceComplianceRegulatoryInformation/guidances/default.htm]
30. Knezevic NN, Cicmil N, Knezevic I, Candido KD. Discontinued neuropathic pain therapy between 2009-2015. Expert Opin on Investig Drugs 24, 1631-1646 (2015). [CrossRef]
31. Skende E, Chen YL, Maier G, Zhang ZP. Determination of D-serine in human plasma by enantioselective liquid chromatography with tandem mass spectrometric detection, the 3rd European Bioanalysis Forum (EBF) annual meeting, December 2010, Barcelona, Spain.
All site content, except where otherwise noted, is licensed under a Creative Commons Attribution 4.0 License
